Stockwatch: does drop make this UK bank share an astute buy?
This share tip has returned 42% and generated some attractive dividend income, but it had been as much as 78% in the summer. Analyst Edmond Jackson updates his view following recent results.
5th December 2025 10:06
by Edmond Jackson from interactive investor

Following my recent piece on Budget implications, it is interesting to engage a “challenger” bank that has reported annual results to 30 September, as to what its lending specifics tell us about where the economy is heading.
- Our Services: SIPP Account | Stocks & Shares ISA | See all Investment Accounts
Paragon Banking Group (LSE:PAG), a £1.5 billion mid-cap that originated in 1985 as the National Home Loans Corporation and launched into banking in 2014, has seen its shares fall 7%, as if the results affirm a market downtrend since July. They now trade just below the 200-day moving average in an uptrend that’s two years old:
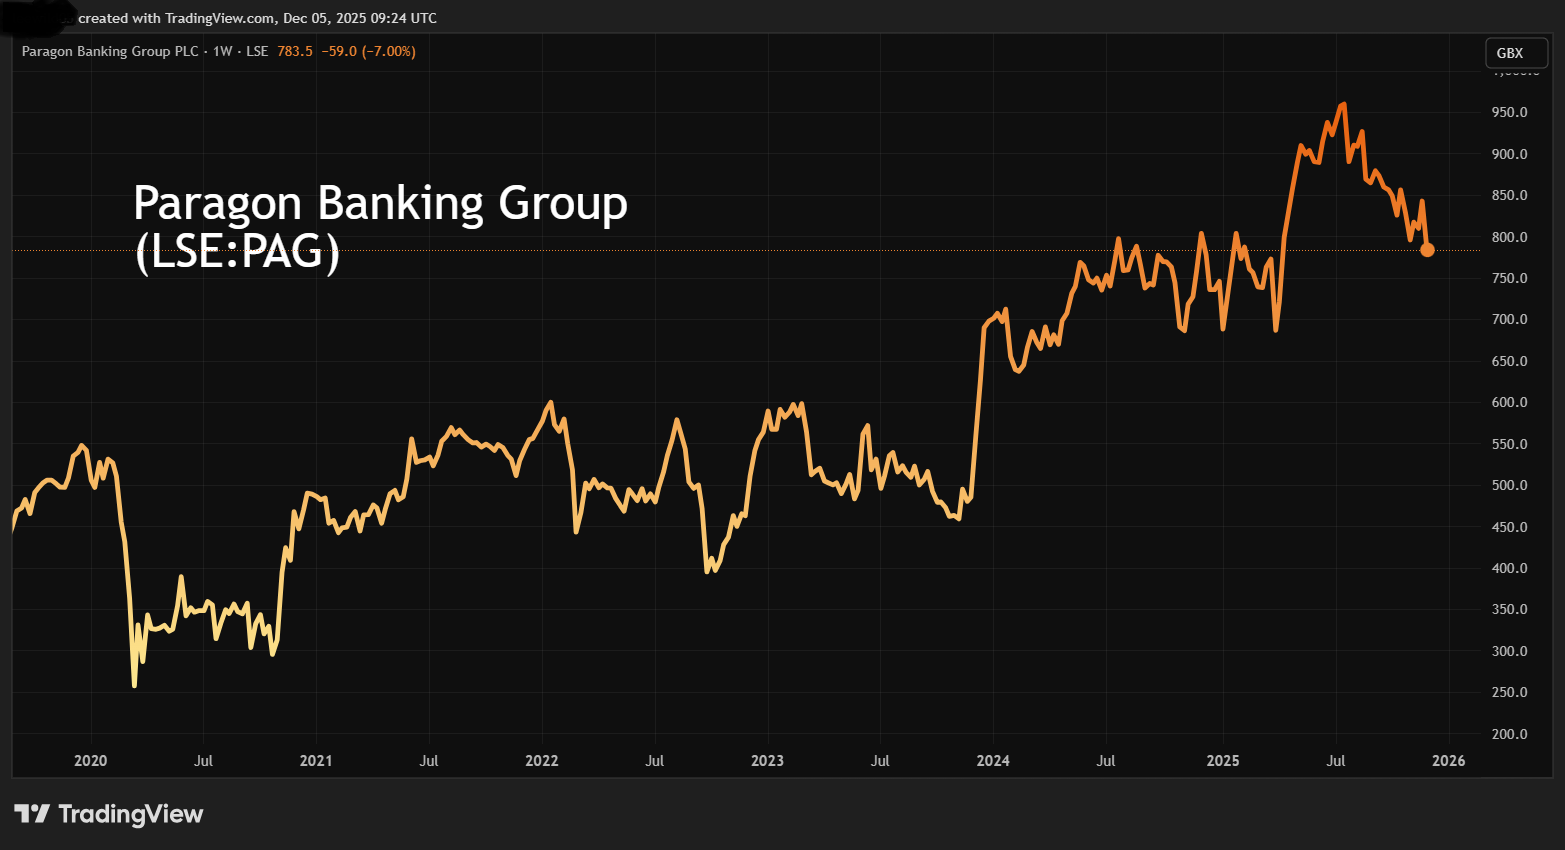
Source: TradingView. Past performance is not a guide to future performance.
Despite good annual numbers overall, I suspect the market’s cautious response is linked to a 71% jump in impairments in the development finance portfolio – as if a tell-tale sign about the economy regarding how growing private companies are starting to hit trouble.
Such an indicator can seem akin to the Begbies Traynor Group (LSE:BEG) “Red Flag Alert” reports where the last on 30 October cited a 78% year-on-year increase in UK businesses in “critical” financial distress, a near 13% increase on the second quarter of 2025. But you would expect the kind of businesses in Paragon’s development capital portfolio to be “best picks” rather than over-geared “zombies” typifying Begbies’ reports.
- Glencore investor meeting sends shares to 10-month high
- Sign up to our free newsletter for investment ideas, latest news and award-winning analysis
So, despite the Office for Budget Responsibility (OBR) slightly upgrading its UK macro forecast for 2025, with a slight downgrade thereafter, such business-specific indicators are a concern.
Directors buy despite mixed annual numbers and narrative
Yesterday, the CEO bought £237,585 worth of Paragon shares and the CFO £144,653 worth, both at 785p relative to 781p currently, underlining their confidence in prospects.
The results release is headlined with a 17.5% underlying return on tangible equity (I calculate 12.7% on a reported basis) with 8.7% dividend growth and new £50 million share buyback scheme relative to a £1.6 billion market value. Underlying earnings per share (EPS) of 109.7p being at a record level (although 87.9p reported EPS is below 2022, see table).
Paragon Banking Group
year-end 30 Sep
| 2017 | 2018 | 2019 | 2020 | 2021 | 2022 | 2023 | 2024 | 2025 | |
| Turnover (£ million) | 429 | 499 | 535 | 509 | 458 | 568 | 1,028 | 1,328 | 1,262 |
| Operating margin (%) | 33.7 | 36.4 | 29.7 | 23.3 | 46.7 | 73.6 | 19.5 | 19.1 | 20.3 |
| Operating profit (£m) | 145 | 182 | 159 | 118 | 214 | 418 | 200 | 254 | 257 |
| Net profit (£m) | 117 | 146 | 127 | 91.3 | 165 | 314 | 154 | 186 | 180 |
| EPS - reported (p) | 41.9 | 54.2 | 48.2 | 35.7 | 63.0 | 126 | 66.3 | 85.2 | 87.9 |
| EPS - normalised (p) | 41.9 | 54.2 | 48.2 | 35.7 | 63.0 | 126 | 67.2 | 85.2 | 87.9 |
| Operating cashflow/share (p) | 527 | 399 | 151 | 402 | 336 | 469 | 936 | 1,015 | -184 |
| Capital expenditure/share (p) | 0.9 | 0.9 | 1.2 | 1.1 | 1.7 | 1.2 | 1.4 | 2.5 | 1.9 |
| Free cashflow/share (p) | 526 | 398 | 150 | 401 | 334 | 468 | 935 | 1,012 | -186 |
| Dividends per share (p) | 15.7 | 19.4 | 21.2 | 14.4 | 26.1 | 28.6 | 37.4 | 40.4 | 43.9 |
| Covered by earnings (x) | 2.7 | 2.8 | 2.3 | 2.5 | 2.4 | 4.4 | 1.8 | 2.1 | 2.0 |
| Return on total capital (%) | 1.1 | 1.3 | 1.1 | 0.8 | 1.4 | 2.5 | 1.1 | 1.3 | 1.3 |
| Cash (£m) | 1,497 | 1,311 | 1,225 | 1,925 | 1,360 | 1,931 | 2,994 | 2,525 | 2,390 |
| Net debt (£m) | 11,042 | 11,943 | 11,819 | 12,177 | 12,398 | 12,655 | 13,333 | 14,795 | 15,581 |
| Net assets (£m) | 1,009 | 1,074 | 1,108 | 1,156 | 1,242 | 1,417 | 1,411 | 1,420 | 1,420 |
| Net assets per share (p) | 380 | 412 | 432 | 451 | 496 | 596 | 645 | 681 | 732 |
Source: company accounts.
Moreover, the new financial year is described as starting “with good momentum...plenty of opportunity ahead in our chosen specialist markets”.
Yet, as with contractors where investors often take their cue from changes in the “backlog” (work in progress) or order book, I am interested in lending specifics.
Paragon says that its net loan book has grown by 4.0% to £16.3 billion, although I note that demand for loans appears to be stable to slightly softening given total new lending is £2.68 billion versus £2.73 billion a year ago.
Mortgage lending advances are flat at £1.49 billion albeit with strong customer retention contributing to loan book growth of 3.4%. Commercial advances have eased 4% to £1.19 billion, with development finance and motor showing growth. The overall commercial loan book is up 7.6% to £2.46 billion.
Paragon says: “Combined pipelines are stable year-on-year with customer activity expected to recover as rates fall and Budget uncertainty fades.” Obviously, that depends on whether interest rates do indeed come down, starting with maybe a notional 0.25% when Bank of England policymakers next meet on 18 December, to assuage fears while also countering stubborn inflation.
There appears to me a slight sense here of professing sunny uplands albeit a macro liability about how things could get blown off course by unfavourable gusts.
Since the Autumn Budget, I have seen at least one YouTube clip and a separate news piece with buy-to-let (BTL) landlords bleating about how government increasingly intervenes on the side of tenants, making a landlord business model less attractive to the point of non-viability. The Renters’ Rights Act, effective from May 2026, will be a significant test. Yet page 13 of Paragon’s results cites specialist landlords letting four or more properties, as “target customers” in the private rented and BTL mortgage market.
It’s unclear whether such media examples are isolated relative to Paragon saying overall demand for BTL mortgages remains robust. Note 11 to the balance sheet cites total mortgage lending at £13,786 million, but its elements are unspecified. Since mortgage lending at 30 September constituted 85% of total lending, people’s confidence to act overall in housing is very significant to Paragon’s medium-term prospects. Possibly two interest rate cuts would indeed help.
“Development finance” is not even 6% of total lending, so while its 71% jump in impairments is notable, perhaps the fall in share price is a bit harsh if related to this. Commercial lending at 15% of group total is still important for Paragon given that this has wider margins than buy-to-let lending.
Net interest margin effectively flat along with deposits
Net interest margin, or NIM, is the difference between what a bank makes from interest on loans and what it pays out to depositors. In a context of “stable” retail deposits of £16.3 billion providing “strong liquidity”, the net interest margin is 0.03% lower at 3.13%, albeit “ahead of expectations due to controlled growth and careful management of funding options”. Flat deposits versus 4% growth in the loan book ought to help.
From the income statement, we see that net interest income is up 4% to £502 million. However, there are £25.5 million of provisions for liabilities (note 25 clarifies as historic motor finance commissions-related) plus credit losses up 71% to £41.9 million, conflated to reduce operating profit before fair value items by 8% to £268 million.
Fair value items relate to hedging and derivatives employed where the net loss reduced from £39 million to £12 million, helping protect profit such that even after a 12% higher tax charge, net profit slipped just 3% to £180 million.
The income statement is thus broadly stable, with a 3% gain in diluted EPS achieved through buybacks. Much seems to depend on where the economy, hence borrower confidence, heads.
Net cash from operations substantially reversed
A brief cash flow statement shows £2,216.4 million generated in the September 2024 year becoming £377.4 million absorbed; note 30 clarifies as chiefly a big swing from £3,034 million inflow from retail deposits (an operating liability) to £32 million outflow.
The table above shows this being the first year of eight prior years showing very strong cash generation versus negligible capital expenditure needs, hence ample free cash flow per share.
The dividend payout policy is 40% of underlying EPS, disregarding fair value losses, and consensus is for the 43.9p dividend per share to rise around 5% this financial year and by 8% to 50p in respect of 2027. That implies a 5.9% yield rising to 6.4% - which seems a fair pricing of the shares at 785p considering the risks.
- The Income Investor: does BP have dividend investing appeal?
- Five macro themes tipped to shape markets in 2026
Net tangible asset value is up 7% to 643p albeit due to buybacks; otherwise, net assets have barely improved. The shares are thus at a 21% premium, illustrating how banks have re-rated since December 2023 when I last wrote on Paragon, rating it a “buy” at 550p at 0.8x tangible assets. That was a time of steep discounts in bank shares: Lloyds Banking Group (LSE:LLOY) similarly was at 0.8x, and Barclays (LSE:BARC) and Metro Bank Holdings (LSE:MTRO) at 0.3x.
Back then, the asset discount, a forward price/earnings (PE) ratio of 6x and yield near 7% looked attractive given that management professed a resilient outlook. If consensus is fair, the PE is barely much higher at 7x, but take your view on the UK economy and subsequent demand for credit.
Paragon thus is a useful example of economic trends, where its origins and bias towards mortgage lending possibly make it sensitive to interest rate policy. Rate cuts ought to benefit mortgage lending but can check banks’ net interest margin.
The CEO and CFO buy trades argue for at least a “hold” stance, which is where I find myself right now, rather than reiterating a “buy” like I did two years ago, given uncertainty over BTL lending next year.
Edmond Jackson is a freelance contributor and not a direct employee of interactive investor.
These articles are provided for information purposes only. Occasionally, an opinion about whether to buy or sell a specific investment may be provided by third parties. The content is not intended to be a personal recommendation to buy or sell any financial instrument or product, or to adopt any investment strategy as it is not provided based on an assessment of your investing knowledge and experience, your financial situation or your investment objectives. The value of your investments, and the income derived from them, may go down as well as up. You may not get back all the money that you invest. The investments referred to in this article may not be suitable for all investors, and if in doubt, an investor should seek advice from a qualified investment adviser.
Full performance can be found on the company or index summary page on the interactive investor website. Simply click on the company's or index name highlighted in the article.
Disclosure
We use a combination of fundamental and technical analysis in forming our view as to the valuation and prospects of an investment. Where relevant we have set out those particular matters we think are important in the above article, but further detail can be found here.
Please note that our article on this investment should not be considered to be a regular publication.
Details of all recommendations issued by ii during the previous 12-month period can be found here.
ii adheres to a strict code of conduct. Contributors may hold shares or have other interests in companies included in these portfolios, which could create a conflict of interests. Contributors intending to write about any financial instruments in which they have an interest are required to disclose such interest to ii and in the article itself. ii will at all times consider whether such interest impairs the objectivity of the recommendation.
In addition, individuals involved in the production of investment articles are subject to a personal account dealing restriction, which prevents them from placing a transaction in the specified instrument(s) for a period before and for five working days after such publication. This is to avoid personal interests conflicting with the interests of the recipients of those investment articles.