The best places for a new year trust bargain
14th January 2022 15:07
Kepler highlights where current opportunities lie and examines the performance of its Discounted Opportunities Portfolio.

This content is provided by Kepler Trust Intelligence, an investment trust focused website for private and professional investors. Kepler Trust Intelligence is a third-party supplier and not part of interactive investor. It is provided for information only and does not constitute a personal recommendation.
Material produced by Kepler Trust Intelligence should be considered a marketing communication, and is not independent research.
One of the key attractions of investment trusts is the chance of finding a bargain. If shares are bought at a significant discount to NAV and that discount narrows, it offers a source of extra returns not available with an open-ended fund. This can lead to exceptional returns, as has been shown by one graduate of our discounted opportunities portfolio discussed below. However, there are plenty of risks to be aware of. Investing in trusts on the basis of the discount potential alone is a risky business, given the potential for non-investment events to drive discounts – corporate action, illiquid shareholder registers etc. Moreover, discounts can persist for many years when sectors or managers are out of favour. Our discounted opportunities portfolio contains trusts we think represent a double opportunity: a wide discount alongside good NAV potential. Investors should be aware, however, that there is no guarantee that our ideas will be proven correct!
Market review
Markets have shrugged off the Omicron wave in recent weeks, and since we last reviewed discounts in September, equity investors have had a good run. The UK market is up around 6%, and the MSCI ACWI is +5% (see graph below). It’s hard to discern a Santa Rally, however, with returns essentially flat from the start of November.
MARKET PERFORMANCE SINCE LAST REVIEW
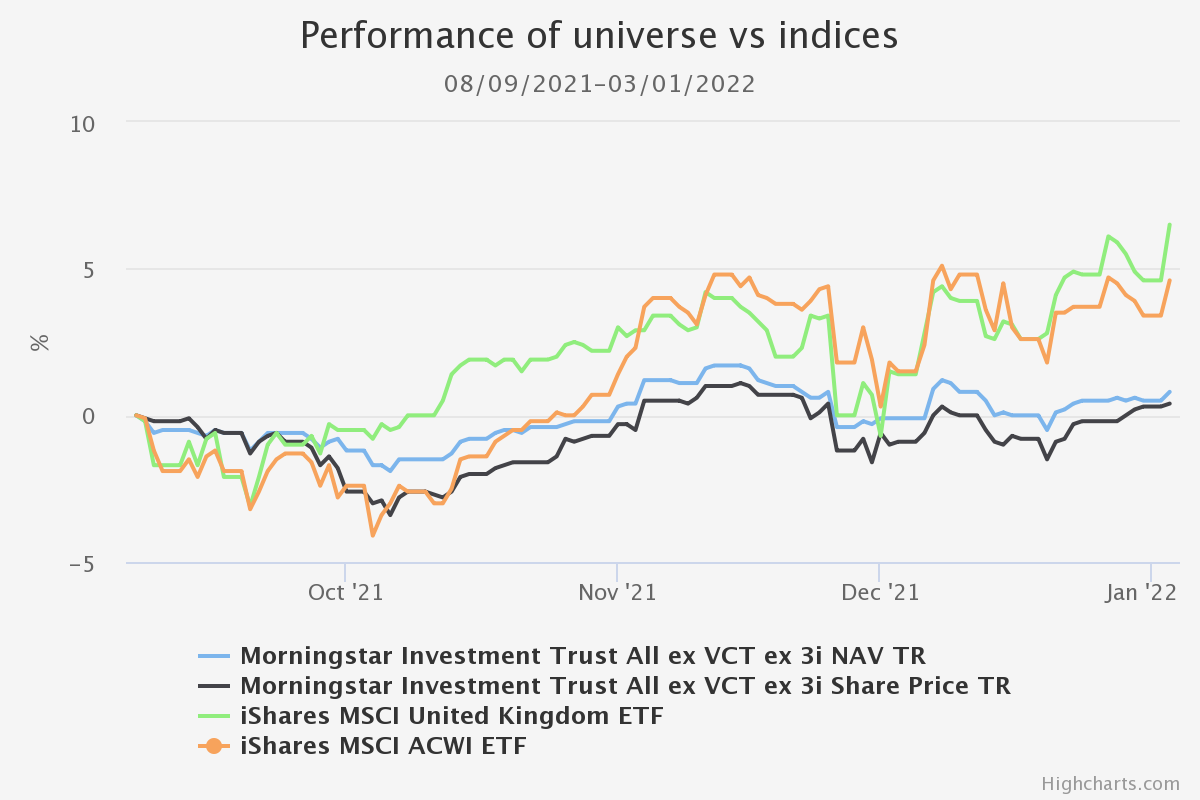
Source: Morningstar. Past performance is not a reliable indicator of future results
Interestingly despite the strong performance of the UK market, the UK All Companies sector was one of those to see its weighted average discount widen the most over the period. This could provide an opportunity in the light of the current omicron situation: the UK has ‘boosted’ faster and further than its international peers and has a smaller immuno-naïve population, which could conceivably lead to a second vaccine bounce in the coming weeks, particularly if, as seems likely, no further restrictions are imposed in England.
The table below shows the ten sectors which have seen their discounts widen the most and the ten which have narrowed the most since 8 September. The leasing sector saw the maritime funds derate over the period after an exceptionally strong run-up in their share prices. The second-largest widening was seen in the Royalties sector. This has been driven by a de-rating for Hipgnosis Songs (LSE:SONG), the older and larger of the two trusts in the sector. It began the period on a premium of around 7%, fell onto a 7% discount and then recovered to par. In our view, this could be an interesting rating for those of a bearish persuasion. If 2022 sees markets come down to earth then Hipgnosis’ steady income with potentially low economic sensitivity could come to be in demand. Like the leasing sector, India and Growth Capital both saw slight de-ratings after a strong period for the shares.
NOTABLE SECTOR DISCOUNT MOVES SINCE LAST REVIEW
| MORNINGSTAR INVESTMENT TRUST SECTOR AVERAGE | WEIGHTED AVE. DISCOUNT % 08/09/2021 | WEIGHTED AVE. DISCOUNT % 31/12/2021 | DISCOUNT MOVE % | NAV TOTAL RETURN % |
| Leasing | -7.7 | -13.4 | -5.8 | 7.7 |
| Royalties | 5.4 | 0.3 | -5.1 | 3.7 |
| UK All Companies | -5.1 | -8.2 | -3.1 | 2.9 |
| Growth Capital | 13.1 | 11.2 | -1.9 | 3.7 |
| Property - Debt | -2.9 | -4.5 | -1.6 | 3.7 |
| India | -10.9 | -12.3 | -1.4 | 14.4 |
| UK Smaller Companies | -5.0 | -6.4 | -1.4 | 1.3 |
| Property Securities | 0.4 | -0.6 | -1.0 | 5.5 |
| Global Emerging Markets | -7.3 | -8.1 | -0.8 | 3.2 |
| Debt - Direct Lending | -4.2 | -5.0 | -0.8 | 3.2 |
| Insurance & Reinsurance Strategies | -19.1 | -15.8 | 3.3 | 4.4 |
| Global | -4.4 | -0.9 | 3.5 | 3.2 |
| Environmental | 4.9 | 8.4 | 3.5 | 5.7 |
| Private Equity ex 3i | -14.8 | -11.2 | 3.7 | 4.6 |
| Renewable Energy Infrastructure | 10.1 | 13.9 | 3.8 | 2.4 |
| Technology & Media | -6.2 | -2.2 | 4.0 | 5.1 |
| Latin America | -10.5 | -5.8 | 4.8 | -16.4 |
| Biotechnology & Healthcare | 0.1 | 5.0 | 4.9 | -0.8 |
| North America Smaller Companies | -6.3 | -0.4 | 5.8 | 5.1 |
| Property - UK Logistics | 21.4 | 27.7 | 6.2 | 1.4 |
Source: Morningstar. Past performance is not a reliable indicator of future results
Turning to those sectors becoming more expensive, the logistics sector in the property market went from strength to strength and has by some way the highest average premium of all sectors in the Morningstar database: +27.7% coming into 2022. The fundamentals are strong for the sector, but dividend yields are now low – the weighted average of the AIC sector is just 2.9%. We think investors on the hunt for discount opportunities might be looking in the conventional property sector now the dust from the pandemic is settling, and this is the source of our new idea for the Discounted Opportunities Portfolio (see below).
Both trusts in the North American Smaller Companies sector have seen their discounts narrow significantly over the period. Brown Advisory US Smaller Companies (LSE:BASC) is a trust we highlighted on a number of occasions as offering potential value. It has moved from a double-digit discount to around 4.5%, while JPMorgan US Smaller Companies (LSE:JUSC) has narrowed close to par. While this is a growth-driven sector, Latin America is very much driven by the value factor, yet BlackRock Latin American (LSE:BRLA) has also seen significant discount narrowing over this period, from almost 12% to 6.5%.
One area of high conviction for us for a considerable time has been private equity. We have long argued that the wide discounts in the sector have been anomalous considering the strong NAV performance and the high ratings of the Growth Capital sector. Private Equity trusts saw a weighted average narrowing of the discount by 3.7 percentage points over this period. One outstanding performer was Oakley Capital Investments (LSE:OCI), a constituent of our discounted opps portfolio, as we discuss below.
Portfolio review
OCI’s discount (according to Morningstar) came in from over 20% to just 6% between 8 September and the New Year. This discount narrowing contributed to a share price total return of 19.7%. This was only matched by NB Private Equity Partners (LSE:NBPE), which saw its discount narrow by 2.5 percentage points (see table below). OCI has been in our Discounted Opportunities Portfolio since we launched it in February 2019. At that time, it was on a discount of 27%. Since then, investors have made a share price total return of 133%, compared to total returns for the FTSE of 22% and the MSCI ACWI of 59% (see graph below). The reported NAV is roughly in line with the returns for the global index, albeit the most recent NAV (30/06/21) is now rather stale. The exceptional share price returns perfectly illustrate the power of buying a good NAV performer on a wide discount. While we can’t argue that at 6% it represents a particularly wide rating, it is worth noting that the discount rests on six month old data. OCI will be announcing its next NAV (as at 31/12/21) in late January, and from then on at quarterly intervals. Since August the discount has moved in considerably (15 percentage points according to Morningstar data). Whilst the real discount (once the NAV is announced) is potentially wider than Morningstar’s estimate, we are banking the impressive share price performance since our last update and as a consequence, bidding it farewell from the discounted opportunities portfolio. As we state in our recent update on the trust, we remain confident on the long term progress for OCI.
PERFORMANCE SINCE OCI’S ENTRY INTO PORTFOLIO
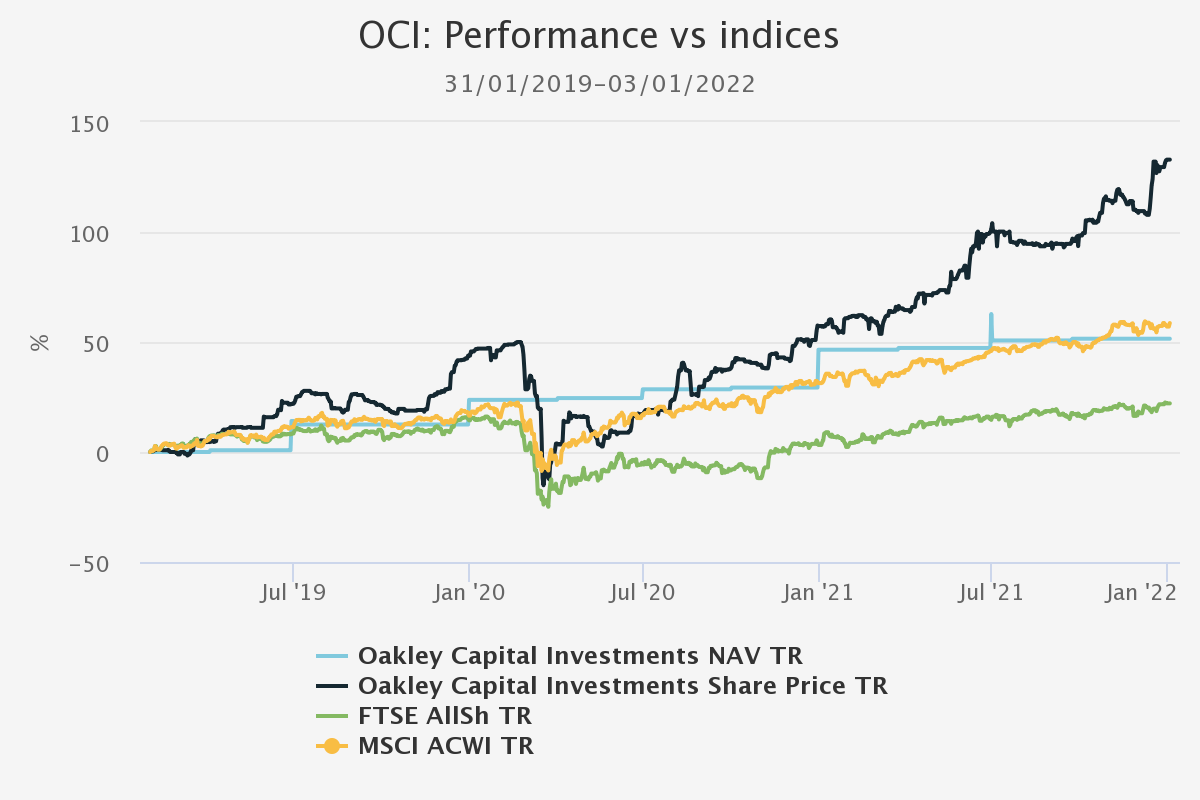
Source: Morningstar. Past performance is not a reliable indicator of future results
The full Discounted Opportunities portfolio is shown below. After OCI, the next most significant discount narrowing was seen by Scottish Oriental Smaller Companies (LSE:SST)– 4 percentage points. This has followed a relatively good period for NAV returns, as we discussed in a recent note. Another factor that could lead to a narrower discount in future is the introduction of five-yearly conditional tender offers. The first will be held in 2026 if performance targets aren’t met.
PERFORMANCE OF DISCOUNTED OPPORTUNITIES PORTFOLIO SINCE LAST UPDATE
| DISCOUNT (%) 08/09/2021 | DISCOUNT (%) 03/01/2022 | DISCOUNT MOVE (PP) | NAV TR (%) | SHARE PRICE TR (%) | |
| Oakley Capital Investments (LSE:OCI) | -21.1 | -6 | 15.1 | 0.6 | 19.7 |
| Scottish Oriental Smaller Companies (LSE:SST) | -14 | -10 | 4 | 2.2 | 4.6 |
| NB Private Equity Partners (LSE:NBPE) | -24.6 | -22 | 2.5 | 14.4 | 19.7 |
| Schroder Japan Growth (LSE:SJG) | -12.3 | -10.3 | 2 | -3.8 | -2 |
| Aberdeen Standard Asia Focus (LSE:AAS) | -13.3 | -11.4 | 1.8 | 5 | 8.7 |
| CC Japan Income & Growth (LSE:CCJI) | -12.3 | -11.2 | 1 | -0.9 | 1 |
| Menhaden Resource Efficiency (LSE:MHN) | -27.6 | -28.1 | -0.5 | -1.9 | -2.6 |
| Downing Strategic Micro-Cap Inv (LSE:DSM). | -16.1 | -17.8 | -1.7 | -13.3 | -11.8 |
| Aberdeen Smaller Companies Inc | -12.4 | -15.1 | -2.7 | -2.8 | -5 |
| Riverstone Energy (LSE:RSE) | -32.7 | -42.8 | -10.2 | 19 | 3.3 |
| AVERAGE | -18.6 | 17.5 | 1.1 | 3.6 | 1.9 |
| FTSE AllSh TR GBP | 2.7 | ||||
| MSCI ACWI NR USD | 4.4 |
Source: Morningstar. Past performance is not a reliable indicator of future results
The greatest discount widening was seen by Riverstone Energy. RSE had an outstanding year, with the NAV up c. 78%. However, the shares have drifted since September as reopening and reflationary trades paused. The trust is on the widest discount in our portfolio, which we think still offers the potential for excellent returns. The board will decide whether to wind up the company by the end of this year.
New Addition: BREI
To replace OCI, we are bringing in BMO Real Estate Investments (LSE:BREI). As at 03/01/2021, BREI was trading on a 22.6% discount, the widest of the direct UK property generalist trusts and wider than all but two of our portfolio constituents. BREI is a commercial property trust with just over half the portfolio invested in the industrials sector. Under manager Peter Lowe the trust has run down its conventional retail exposure to just 6.5%. BREI is one of the smaller trusts in the sector, with net assets of £266m. Gearing is high relative to the peer group, with 26% net gearing compared to an average of 18% (according to Morningstar data). These two factors may have contributed to its discount remaining wider than average and more volatile. There may also be some lingering memories in the market of the more retail-heavy portfolio of five years ago.
Commercial property trusts had a torrid time during the pandemic, but NAVs have now largely recovered. BREI’s portfolio is trading on a higher valuation than pre-pandemic, and it now yields 4.6% on a prospective basis, with the dividend only at 80% of pre-pandemic levels. We think this yield is likely to look increasingly attractive this year as inflation kicks in – real estate is a fairly good hedge for inflation as a rule. While investors have preferred specialist logistics trusts, these now have fairly unappealing yields, and with the shape of the economy after the pandemic seeming clearer, we think 2022 could see investors nibbling at the higher yields on generalist trusts like BREI.
UPDATED DISCOUNTED OPPORTUNITIES PORTFOLIO
| TRUST | SECTOR | DISCOUNT (CUM FAIR) 03/01/2022 | TARGET |
| Aberdeen Smaller Companies Income | AIC UK Smaller Companies | -15.1 | Level with SLS' discount (currently - 7.6%) |
| Aberdeen Standard Asia Focus (LSE:AAS) | AIC Asia Pacific Smaller Companies | -11.4 | <5% |
| BMO Real Estate Investments (LSE:BREI) | AIC Property - UK Direct | -22.6 | <5% |
| CC Japan Income & Growth (LSE:CCJI) | AIC Japan | -11.3 | Par |
| Downing Strategic Micro-Cap (LSE:DSM) | AIC UK Smaller Companies | -17.8 | Level with UK Smaller Companies sector average (currently -8.6%) |
| Menhaden (LSE:MHN) | AIC Environmental | -28.1 | Level with Global sector average (currently -2.8%) |
| NB Private Equity (LSE:NBPE) | AIC Private Equity | -22.1 | <10% |
| Riverstone Energy (LSE:RSE) | AIC Commodities & Natural Resources | -42.8 | Par (or wind up) |
| Schroder Japan Growth (LSE:SJG) | AIC Japan | -10.3 | Par |
| Scottish Oriental Smaller Cos (LSE:SST) | AIC Asia Pacific Smaller Companies | -10.0 | <5% |
Source: Morningstar
Kepler Partners is a third-party supplier and not part of interactive investor. Neither Kepler Partners or interactive investor will be responsible for any losses that may be incurred as a result of a trading idea.
These articles are provided for information purposes only. Occasionally, an opinion about whether to buy or sell a specific investment may be provided by third parties. The content is not intended to be a personal recommendation to buy or sell any financial instrument or product, or to adopt any investment strategy as it is not provided based on an assessment of your investing knowledge and experience, your financial situation or your investment objectives. The value of your investments, and the income derived from them, may go down as well as up. You may not get back all the money that you invest. The investments referred to in this article may not be suitable for all investors, and if in doubt, an investor should seek advice from a qualified investment adviser.
Full performance can be found on the company or index summary page on the interactive investor website. Simply click on the company's or index name highlighted in the article.
Important Information
Kepler Partners is not authorised to make recommendations to Retail Clients. This report is based on factual information only, and is solely for information purposes only and any views contained in it must not be construed as investment or tax advice or a recommendation to buy, sell or take any action in relation to any investment.
This report has been issued by Kepler Partners LLP solely for information purposes only and the views contained in it must not be construed as investment or tax advice or a recommendation to buy, sell or take any action in relation to any investment. If you are unclear about any of the information on this website or its suitability for you, please contact your financial or tax adviser, or an independent financial or tax adviser before making any investment or financial decisions.
The information provided on this website is not intended for distribution to, or use by, any person or entity in any jurisdiction or country where such distribution or use would be contrary to law or regulation or which would subject Kepler Partners LLP to any registration requirement within such jurisdiction or country. Persons who access this information are required to inform themselves and to comply with any such restrictions. In particular, this website is exclusively for non-US Persons. The information in this website is not for distribution to and does not constitute an offer to sell or the solicitation of any offer to buy any securities in the United States of America to or for the benefit of US Persons.
This is a marketing document, should be considered non-independent research and is subject to the rules in COBS 12.3 relating to such research. It has not been prepared in accordance with legal requirements designed to promote the independence of investment research.
No representation or warranty, express or implied, is given by any person as to the accuracy or completeness of the information and no responsibility or liability is accepted for the accuracy or sufficiency of any of the information, for any errors, omissions or misstatements, negligent or otherwise. Any views and opinions, whilst given in good faith, are subject to change without notice.
This is not an official confirmation of terms and is not to be taken as advice to take any action in relation to any investment mentioned herein. Any prices or quotations contained herein are indicative only.
Kepler Partners LLP (including its partners, employees and representatives) or a connected person may have positions in or options on the securities detailed in this report, and may buy, sell or offer to purchase or sell such securities from time to time, but will at all times be subject to restrictions imposed by the firm's internal rules. A copy of the firm's conflict of interest policy is available on request.
Past performance is not necessarily a guide to the future. The value of investments can fall as well as rise and you may get back less than you invested when you decide to sell your investments. It is strongly recommended that Independent financial advice should be taken before entering into any financial transaction.
PLEASE SEE ALSO OUR TERMS AND CONDITIONS
Kepler Partners LLP is a limited liability partnership registered in England and Wales at 9/10 Savile Row, London W1S 3PF with registered number OC334771.
Kepler Partners LLP is authorised and regulated by the Financial Conduct Authority.