The chart that predicts the gold price will slide below $1,000 in 2017
7th December 2016 09:00
by David Brenchley from interactive investor
Amongst all the political and economic upheaval seen this year, one of the big questions on investors' lips going into 2017 will be regarding gold.
Having tested the $1,000 mark towards the end of 2015, the precious metal was the best-performing asset in the first quarter of 2016, benefiting from uncertainty surrounding events such as the UK's referendum on European Union membership and the US presidential elections.
Gold is seen as a safe haven for investors, so with question marks around the direction of global stockmarkets and a weak dollar it shot up to highs of $1,400 midway through the year.
This led to incredible gains for funds focused on the metal, with the one-year performance of the likes of and up around 170% as recently as September.
Where next for the gold price?
Since then, though, markets seem to have taken the spectre of Brexit and a looming Donald Trump presidency in their stride and the gold price has slipped to trade at below $1,200 at the time of writing (5 December).
Investors who have exposure to gold will now be weighing up whether the precious metal's bull run has ended.
Whilst there is every chance the gold price may rally in the short term, says Chris Beauchamp, head of market analysis at IG Group, using historic trends shown in the gold price chart below as a guide suggests there is a longer-term downtrend - and "it could easily go under $1,000 before the end of 2017".
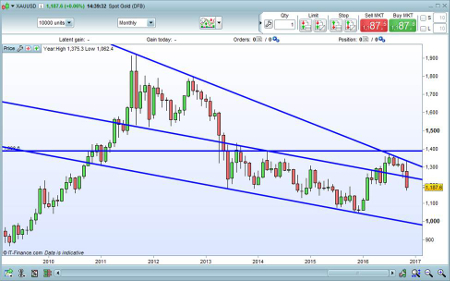
Beauchamp explains the methodology behind the blue lines in the chart: "The descending lines represent resistance, areas where buying pressure runs out and selling takes over.
"Having fallen back into the descending channel, it looks likely that the price will head back to the bottom line, which would suggest a price below $1,000, and potentially lower."
The rally at the beginning of the year caught most analysts on the hop, Beauchamp adds; most assumed that the downward movement towards the end of 2015 would continue until it was well below $1,000.
"But, as is the way of the market, it turned round; it caught everyone on the hop and suddenly gold was back en vogue," he explains.
Now, though, there are question marks, with a few divergent forces threatening to push the precious metal one way or the other. On the bull side, rising inflation could help the price as gold is widely seen as an inflationary hedge.
However, Beauchamp says, "it's likely that the rising US dollar and an improving US economy takes the lead on that and actually you see gold headed lower".
"The recovery, risk appetite and the fact that the US dollar is now on this wonderful value has essentially spiked the guns of gold bulls… [and] you can see the direction of travel."

This article was originally published in our sister magazine Money Observer. Click here to subscribe.
This article is for information and discussion purposes only and does not form a recommendation to invest or otherwise. The value of an investment may fall. The investments referred to in this article may not be suitable for all investors, and if in doubt, an investor should seek advice from a qualified investment adviser.