Commodities outlook: This is what's hurting oil prices now
America has overtaken Saudi Arabia as the world's top oil exporter. Here's what it means for oil prices.
12th September 2019 12:01
by Rajan Dhall from interactive investor
America has overtaken Saudi Arabia as the world's top oil exporter. Here's what it means for oil prices.

There have been lots of developments since my last update, so let's dive right in with the oil markets.
Over the weekend, long-standing Saudi Energy Minister Al Falih was ousted, leaving the OPEC nations in a state of ambiguity. The new energy minister, Prince Abdulaziz bin Salman bin Abdulaziz al-Saud, the half-brother of Saudi Crown Prince Mohammed bin Salman seemed to take on the roll with good faith, and said he is behind the Saudi Aramco IPO and the cuts issued by OPEC.
Today it was announced that OPEC may be looking into another 400,000 barrel per day cut. These are market rumours at the moment, but the OPEC meeting takes place at the time of writing so I look forward to hearing the outcome. It is clear that much work is needed by the oil cartel as the US surpassed Russia and Saudi Arabia as the world’s largest oil producer and show no signs of slowing down.
Across the pond, in the US there was movement in the White House. National Security Advisor John Bolton was sacked by US President Donald Trump, which could ease concerns of a military conflict with Iran.
Iran's leader Hassan Rouhani says he may be willing to meet with Trump to discuss the economic sanctions imposed by the US, and the American reacted in a surprisingly warm manner. This led to a 3.36% drop in the price of spot West Texas Intermediate (WTI) yesterday.
Lastly, we received the latest report today from the International Energy Agency which said OPEC faces a "daunting" market in 2020 with the return of a "significant surplus" which will place "pressure on prices".
It went on to tweet that 2019 and 2020 global oil demand growth forecasts stayed unchanged at 1.1 million barrels per day and 1.3 million barrels per day, and that OECD commercial stocks increased by 1.5 million barrels in July. Also, the US overtook Saudi Arabia to become the world’s top oil exporter in June. So it seems there is more fundamental pressure on the oil market.
Looking at the technicals now (see chart below), there was a sharp move lower yesterday.
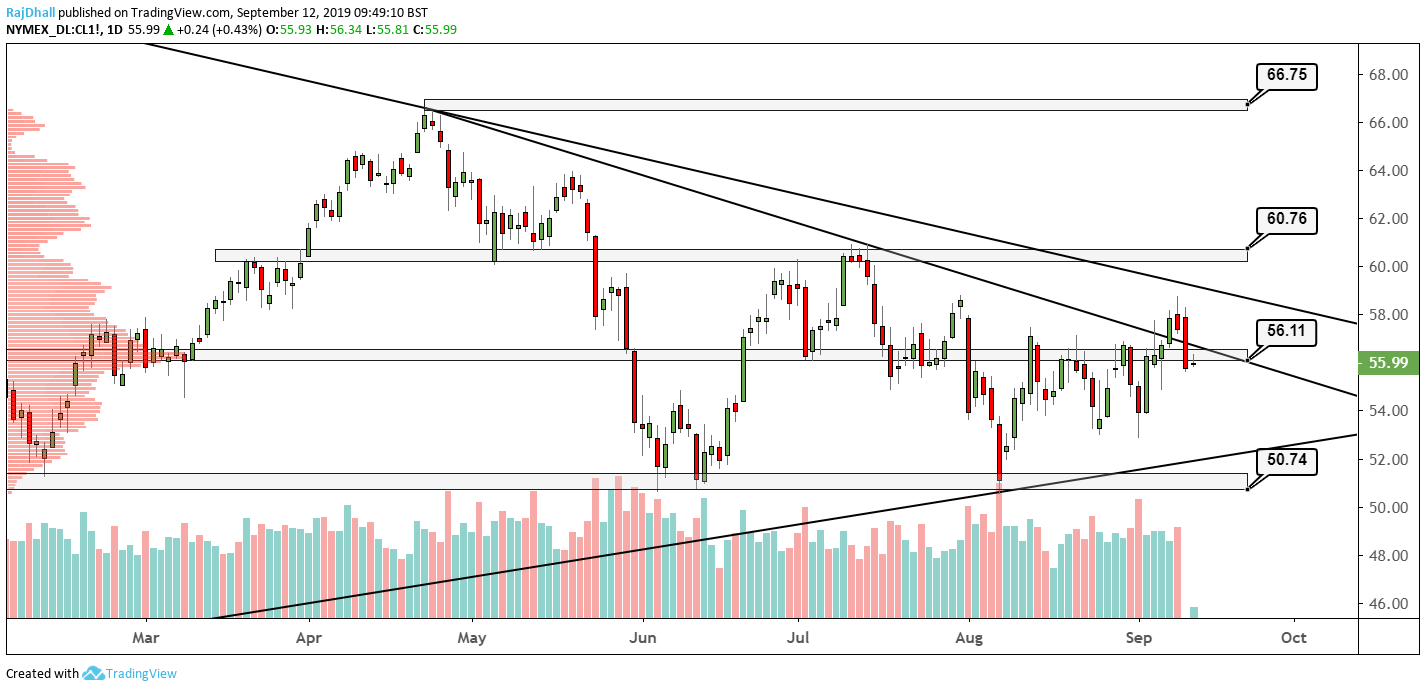
Source: TradingView Past performance is not a guide to future performance
The oil price is now in the mean value area, which is represented by the volume profile indicator on the left-hand side of the chart.
The peak of the bell curve shows that this is the price where most contracts changed hands on the NYMEX futures exchange.
Elsewhere, the next support level is quite far down at $50.74 dollars per barrel and, if the bearishness continues, the price could be headed that way.
Rajan Dhall is a freelance contributor and not a direct employee of interactive investor.
These articles are provided for information purposes only. Occasionally, an opinion about whether to buy or sell a specific investment may be provided by third parties. The content is not intended to be a personal recommendation to buy or sell any financial instrument or product, or to adopt any investment strategy as it is not provided based on an assessment of your investing knowledge and experience, your financial situation or your investment objectives. The value of your investments, and the income derived from them, may go down as well as up. You may not get back all the money that you invest. The investments referred to in this article may not be suitable for all investors, and if in doubt, an investor should seek advice from a qualified investment adviser.
Full performance can be found on the company or index summary page on the interactive investor website. Simply click on the company's or index name highlighted in the article.