How this Budget might make UK stocks 'very attractive' again
30th October 2018 13:38
by Rebecca O'Keeffe from interactive investor
Share prices have hardly budged on this Budget, but Rebecca O'Keeffe wonders whether, with a bit of luck, Hammond's policies could dramatically improve investor sentiment.

Was yesterday's budget a damp squib? A piece of political theatre vainly attempting to prolong a zombie government dependent on the rapidly diminishing goodwill of the determined Brexiteers and the DUP? Or will 29 October 2018 be remembered as the day when Spreadsheet Phil cut austerity and pasted fiscal stimulus in its place?
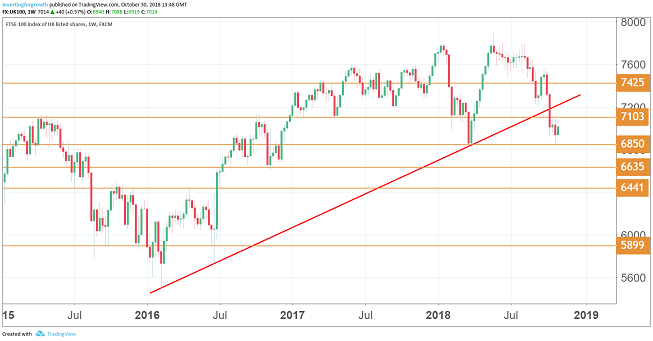
With the FTSE 100 bumping along close to two-year lows, you would be forgiven for concluding that the former argument is correct. But what if the latter scenario proves to be sufficiently politically attractive to win over middle-England, and a last-minute Brexit compromise can be achieved?
Yesterday, the Chancellor promised to boost spending by around £75 billion over the coming five years. If a satisfactory Brexit deal can be agreed, he even suggested that there might be more room for spending to increase.
Contrast that potential outcome with the current "view" priced into UK-focused stocks.

Source: TradingView (FTSE 100 one-week chart) (*) Past performance is not a guide to future performance
Thanks to the cliff-edge Brexit scenario, no self-respecting international investor owns UK stocks, indeed there are not too many UK investors who have been net buyers in recent months either.
Price/earnings (PE) ratios for companies dependent on the UK economy and its long-suffering consumers are widely available in the 5-10 region, akin to where they might be expected to be found heading into a modest recession.
If a post-Brexit UK economy with stronger public sector spending is accompanied by even moderate growth in real incomes, the UK suddenly begins to look like a very attractive investment proposition once again.
*Horizontal lines on charts represent previous technical support and resistance. Diagonal red line represents uptrend since 2016.
These articles are provided for information purposes only. Occasionally, an opinion about whether to buy or sell a specific investment may be provided by third parties. The content is not intended to be a personal recommendation to buy or sell any financial instrument or product, or to adopt any investment strategy as it is not provided based on an assessment of your investing knowledge and experience, your financial situation or your investment objectives. The value of your investments, and the income derived from them, may go down as well as up. You may not get back all the money that you invest. The investments referred to in this article may not be suitable for all investors, and if in doubt, an investor should seek advice from a qualified investment adviser.
Full performance can be found on the company or index summary page on the interactive investor website. Simply click on the company's or index name highlighted in the article.