How to find the active fund managers that really stand out
We examine the tools investors can use to assess how active a manager actually is.
28th June 2019 15:51
This content is provided by Kepler Trust Intelligence, an investment trust focused website for private and professional investors. Kepler Trust Intelligence is a third-party supplier and not part of interactive investor. It is provided for information only and does not constitute a personal recommendation.
Material produced by Kepler Trust Intelligence should be considered a marketing communication, and is not independent research.
In the first of a two-part series, we examine the tools investors can use to assess how active a manager actually is.

Measure for measure
William Sobczak, analyst at Kepler Trust Intelligence
In recent years active management has been under almost constant attack from the rise of passive funds. Yet threats often give rise to opportunities: we believe that complacency is always the real enemy, and so competition from passive funds can be seen as a positive development in the industry.
Active managers have been forced to up their game, and as we discuss below, our research shows that the UK closed-ended universe has become significantly more active in response to the challenge of cheap passive products. Here we discuss this shifting landscape, its implications for investors and the varying measures for 'activeness' available to investors.
Becoming more active is the only way to go…
The threat from passive funds has led to active managers becoming more active and to "closet trackers" being pushed out. As we reported in our July 2018 article Go big or go home, academic research shows that the chance of generating alpha rises with how active a manager is. This was demonstrated in Cremers and Petajisto's 2009 work, where they verified that the most "active" stock pickers beat their benchmark on average by about 1.26% a year (after fees), but that closet indexers essentially matched their benchmark index performance before fees (and under-performance after fees).
Furthermore, Cohen, Polk, and Silli (2009) examined the performance of stocks that represent the managers' "best ideas". They discovered that their best ideas were the ones that consistently delivered the greatest returns.
Yet, because of the way that the investment industry has worked in the past, a highly concentrated portfolio has not necessarily been "optimal" for most managers for a number of (mainly non-investment) reasons, and so the tendency is to introduce stocks into their portfolio that they have less conviction on.
For example, large investments in a small number of holdings could, if the picks are bad, put a manager's job security on the line, while a manager has been less likely to be fired for generating returns similar to the benchmark.
Fees are another force driving investors to passives, as active management fees are considerably higher than for passive funds. According to Morningstar, in 2018 an active UK large cap fund would on average have an ongoing charge of 0.75%, compared to just 0.12% for a passive proposition.
The fee differential has meant that over the past few years we have seen demand for passive vehicles dramatically increase. At the end of 2018 there were 323 exchange traded products (also including exchange traded notes and commodities) listed on the London Stock Exchange, close to double the 177 listed in 2017. According to the IA's April 2019 figures, "tracker" funds now equate to £200 billion of funds under management, 10% more than just a year before. And in April this year, tracker funds saw £1.81 billion of net retail sales, more than 10 times the £114 million from equity funds.
This pressure has also had a positive effect for investors in active funds. As we show in our recent research average fees across collective investment funds around the world have seen relentless declines. According to research from Morningstar, the average asset-weighted fee for actively managed equity funds has fallen by 18% since 2013, compared with a 28% decline at passive funds.
Pressure from passive investments means active managers are having to increasingly justify their existence. But, how does one identify those managers that are truly active? In the first part of two articles, we take a look at the different measures for assessing how active a manager is and their relative advantages, highlighting investment trusts that stand out on each of these measures.
How can active management be measured?
Active share is not enough - the most common measure used by investors to gauge how "active" a manager is, certainly in recent times, is active share. Active share was first developed in the aforementioned work in 2009 by Cremers and Petajisto, as a tool for representing the degree positions in a portfolio differentiate from the benchmark index's constituents.
The measure is expressed as a percentage ranging from 0 to 100%, with a fund with no common holdings displaying an active share of 100%. Their research suggests that funds with an active share rating of 80% or more are best placed to outperform over the long term.
For example, Willis Towers Watson assessed 977 global equity funds in 2017. Among these funds, only 256 outperformed their benchmarks over five years. Of those that outperformed, 72% had an active share of over 80%.
Since the research surrounding active share was published, Baillie Gifford has been a strong proponent for its use. Almost all of its funds and investment trusts report their active share, and Edinburgh Worldwide Investment Trust (LSE:EWI), managed by Douglas Brodie and John MacDougall boasts an active share score of 98%. Over the past five years, the trust generated 131% total NAV returns against 68.8% from the S&P Global Smaller Companies Index. Even over the tricky past year, the company has generated 2.6% against -3.2% from the S&P Global Smallers.
Elsewhere, Baillie Gifford's investment trusts boast some of the highest active share ratings across the investment trust universe. Monks (LSE:MNKS), for example, has a 90% score, Scottish Mortgage (LSE:SMT) 94% and Shin Nippon of Japan (LSE:BGS) 93%.
With this said, in recent times issues with the measure have come to light, in particular when using it alone as a measure for active management. For example, the measure can be impacted by the number of stocks making up a benchmark.
Consequently, a single country equity fund would be expected to have a lower active share than a global equity fund, particularly a global small cap fund such as Edinburgh Worldwide, whose benchmark has 8346 individual stocks.
Another problem is that active share can be 'gamed'. For example, consider an index with a weighting to sector A of 20%, made up of four companies each worth 5% of the index.
A manager could put 20% of his or her fund in stock 1 and thereby add 15% to the active share. If, however, the beta of stock 1 to the sector is 1, then the 20% weighting in the fund will behave very similarly to the 20% weighting in the index.
The fund would therefore appear to be highly active, while having less chance of behaving differently from the index than it might first appear. This is an extreme example, but this sort of calculation is used to create passive funds without buying all the stocks in the index by a process called "stratified sampling".
It is, of course, possible that such effects could develop by accident, but managers are also incentivised to exaggerate how active they are to attract investors and justify their fees, at the same time minimizing their active risk to avoid losing their jobs. One of the great benefits of the rise of passives is that behaving like the index is unlikely to be enough to keep an active manager's job, so this incentive is diminishing.
Furthering the flaws of the measure, finding the data required for precise measurement is difficult. The most common databases for analysts and investors, Morningstar and FE Analytics, do not offer active share data for investment trusts and many investment trusts choose not to report it on their factsheets. As such, we think it is important to consider other metrics instead.
Alternative metrics
Tracking error and R2
We think tracking error is an alternative measure that complements active share well. Also known as active risk, tracking error indicates the volatility of the difference in returns between a fund and its benchmark.
Typically the higher the active return (outperformance) in relation to the active risk (tracking error) the better. The advantage is that it is derived from actual returns, so it highlights whether the behaviour of a fund has been unlike the index. The disadvantage is that it is backward-looking, unlike active share which, by examining the current portfolio, is more forward-looking.
Henderson Opportunities (LSE:HOT) is a company that stands out for us from our analysis, with a tracking error of 11.31. The trust currently sits in our Kepler Growth Portfolio and aims to outperform the FTSE All Share by investing across the market cap spectrum. The portfolio of c.90 stocks is dominated by smaller companies, and over 60% is currently invested in AIM.
With UK equities being out of favour thanks to Brexit, and small and mid-caps particularly unloved thanks to a perceived domestic bias, the trust is languishing on almost the widest discount in its AIC peer group (17.2%).
Aberdeen Standard Equity (LSE:ASEI) is another trust highlighted in the list. The trust has long been one of the standout trusts within the AIC UK Equity Income space. Uniquely in that sector, over 60% of the company's portfolio is invested in companies outside the FTSE 100, illustrating the manager’s desire to search in areas of the market that other UK equity income managers may be overlooking. The valuation of a company is extremely important for the manager, Thomas Moore, and he looks to identify stocks with potential for a re-rating in the future.
Within the portfolio the median stock has a PE of 10.6, relative to the FTSE 350 average of c.12.2. Alongside this, the average PB is c.1.5, 25% less than the FTSE 350 average of 2. Currently the trust trades on a discount of 6.2%, 1.9% wider than the sector weighted average, despite boasting a yield of 5.1% relative to the sector weighted average of 3.9%.
Concentration
Portfolio concentration is another measure that can give information about how active a manager is. There are two ways that this can be measured; through the number of holdings and the percentage of assets the top holdings make up. In our view, concentration can be seen as a good measure of the confidence a manager has in his convictions.
Investment trusts, with their closed-ended structure, are in a unique situation which allows a manager a huge degree of latitude in running a concentrated portfolio.
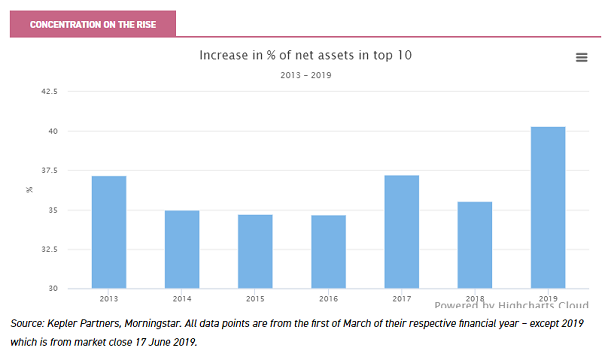
According to our analysis, within the equity investment trust universe, the average number of holdings has steadily reduced over the past five years, with the average trust now having 75 holdings, compared to 91 in 2013.
This represents a decrease of almost 20%, which we think is significant. Indeed, this matches with anecdotal evidence that we pick up when meeting managers, of an increasing desire (led by boards or managers) for a more concentrated approach.
Along with the absolute number of holdings, we are seeing a dramatic increase in the percentage of net assets in the top ten holdings. The average trust now has over 40% of their net assets in their top ten holdings, increasing by nearly 6% from 34% in the prior year.
Recent managers we have met who have told us that they expect to run more concentrated portfolios than they have in the past include JPMorgan American (LSE:JAM) and Henderson EuroTrust (LSE:HNE).
From the 31 May 2019, the new team managing JAM took the helm of the trust, with a significantly more concentrated portfolio. To some extent, this change reflects an extension of the portfolio changes which were made in 2017, where the previous manager was encouraged to increase concentration but also to run winners longer.
The key change to the process is that the portfolio will reflect the best ideas of two managers with very different growth and value stock selection styles. The split between growth and value is expected to remain fairly evenly balanced over time, but never more than a 60:40 tilt either way.
Each manager has ultimate decision-making authority over their stocks in the portfolio, but at all times must have between 10 (minimum) and 20 (maximum) holdings at any one time. Position sizes are related entirely to conviction levels, rather than any other considerations (benchmark constituents etc).
Henderson EuroTrust has similarly increased its concertation. Jamie Ross has taken over as the lead manager of the trust, after Tim Stevenson retired in February 2019 after more than two decades at the helm.
Searching for good quality, reliable companies remains at the heart of the approach, with the end goal of delivering investors consistent returns. Previously, Tim has held around 50 stocks, reaching highs of as much as 60 holdings. However, James is looking to further concentrate this figure and, encouraged the removal of c. 10 holdings, since joining the team. The portfolio now has 41 positions.
This is not only an attempt to differentiate from ETFs, but also to ensure that when winners are selected shareholders benefit fully. This is a point that Jamie feels particularly strongly about and wants to emphasise that his role is to offer conviction in his decisions and to add alpha.
The size of holdings will range between 0.8-1% for the smallest holdings, to 6% for the largest holdings. Typically, the largest positions will be the less risky more steady ideas, whereas the smaller holdings will offer greater return opportunities.
However, although we think concentration is an important metric to look at, it has to be considered relative to the concentration of the index. For example, Tencent Holdings (SEHK:700) makes up 14.62% of the MSCI China Index and Alibaba (NYSE:BABA) 13.07%. A fund which had 28% in the two stocks might therefore be highly concentrated, but in this case this is not telling us much about how active it is.
On a similar theme, a trust could have just thirty holdings, but if the index is relatively concentrated, then the top twenty holdings could be very similarly weighted to the top twenty in the index, and the weights of the remaining ten companies be of limited importance to relative returns. A metric such as tracking error would help to uncover this.
Tactical positioning
In order to understand the active nature of the manager we can also look at how they shift the portfolio over the medium to short term, what we could call tactical positioning.
To assess this we look at gearing and the movement between cyclical and defensive companies. In a way this is the opposite of how we often think about some of the most 'active managers' like Nick Train or Terry Smith, who have very long holding periods and low turnovers.
However, often the trusts that are hit the hardest are those that are over geared during a correction, or those that find themselves overexposed to cyclical companies in a recession, and one possible element of fund management skill could be avoiding such blow-ups.
The past year offers the perfect scenario to understand how varying managers look to navigate through both corrections and strong rallies. Over the second half of 2018 we saw a non-recessionary correction across almost every global market, and this has since rebounded in Q1 and Q2 of 2019.
Needless to say, the greater the gearing the more risk and the likely under or out-performance of a trust relative to peers and the benchmark. As can be seen below, managers did in fact reduce their gearing over the last half of 2018.
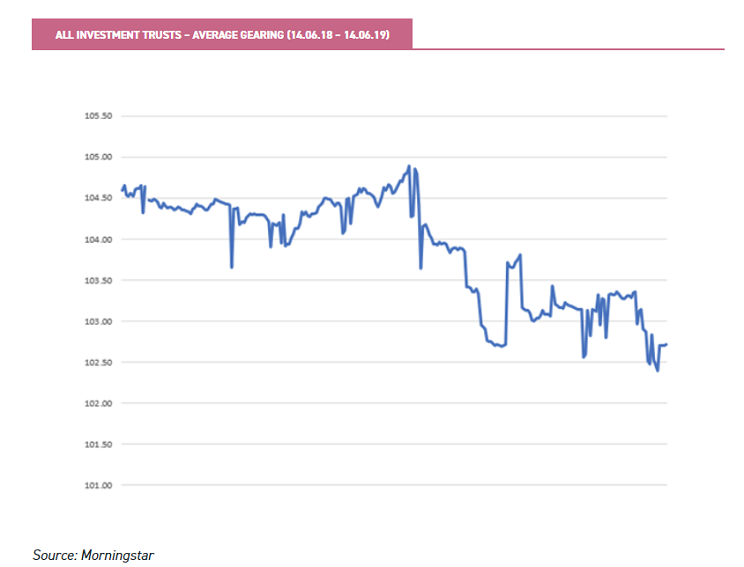
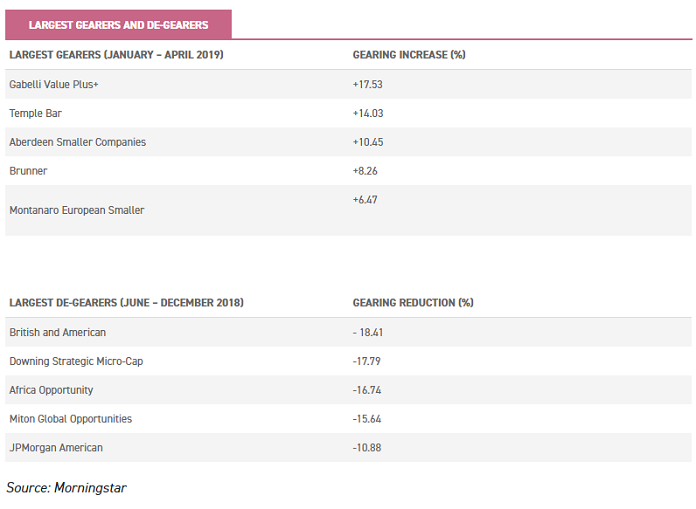
According to Morningstar, the likes of JPMorgan European Smaller Companies (LSE:JESC), Henderson EuroTrust, and Schroder AsiaPacific (LSE:SDP) decreased their gearing by around 5% between June 2018 and December 2018. Miton Global Opportunities (LSE:MIGO) reduced gearing by over 15% over the same period.
However, as the graph illustrates, on average the managers haven't had the foresight (or nerves) to re-gear during the rebound. This isn't true of all managers though and Aberdeen Smaller Companies Income, Gabelli Value Plus+ Trust (LSE:GVP), Brunner (LSE:BUT) and Aberdeen Frontier Markets Investment (LSE:AFMC) all increased gearing by more than 5% between December and April of 2019.
Below we show the trusts which have been most active in de-gearing and re-gearing through the second half of last year's market turmoil. While this doesn't show who has been most successful in their tactical positioning (to do that we need to analyse who de-geared prior to market falls and now after the worst had happened) it does illustrate the managers who take the most active attitude to leverage and market timing.
In terms of movement between cyclical and defensive companies we see more discrepancies, and this is clearly another area that we can see some managers are far more active than others.
Across the board, the second half of the year saw the majority of managers move away from cyclical companies, as many believed defensive companies would hold up better through the uncertainty.
JPMorgan Claverhouse (LSE:JCH) for example had the largest shift away from cyclical companies of any investment trust, over the 6 months to the end of 2018, reducing exposure by 11.3%. This is very much reflective of the managers' recognition of uncertainties surrounding global markets, including the US-China trade war, whether Europe can regain a little vigour and how the Brexit negotiations will turn out. At the other end of the spectrum, Merchants Trust (LSE:MRCH) increased its cyclical exposure by over 12%. This was largely due to the manager’s valuation-led approach to investing, and the attractive opportunities in the UK.
These contrasting moves show us one way managers can be active and add value, and the differing opinions among managers can drive outperformance relative to peers and in turn alpha relative to the benchmark. Of course, as with gearing, we have not analysed whether these moves have been on aggregate net positive and alpha generating, as our focus is on highlighting the most active managers, not the most successful.
The next step
Each of the measures we have looked at above tells a slightly different story about the trust. When combined together we believe they will help to uncover the most active trusts, and in the next article we will put these measures together to highlight the top scorers. We will also compare these trusts, and the broader closed-ended universe, to their open-ended peers to uncover whether investment trust managers are more active than open-ended fund managers.
Kepler Partners is a third-party supplier and not part of interactive investor. Neither Kepler Partners or interactive investor will be responsible for any losses that may be incurred as a result of a trading idea.
Full performance can be found on the company or index summary page on the interactive investor website. Simply click on the company's or index name highlighted in the article.
Important Information
Kepler Partners is not authorised to make recommendations to Retail Clients. This report is based on factual information only, and is solely for information purposes only and any views contained in it must not be construed as investment or tax advice or a recommendation to buy, sell or take any action in relation to any investment.
This report has been issued by Kepler Partners LLP solely for information purposes only and the views contained in it must not be construed as investment or tax advice or a recommendation to buy, sell or take any action in relation to any investment. If you are unclear about any of the information on this website or its suitability for you, please contact your financial or tax adviser, or an independent financial or tax adviser before making any investment or financial decisions.
The information provided on this website is not intended for distribution to, or use by, any person or entity in any jurisdiction or country where such distribution or use would be contrary to law or regulation or which would subject Kepler Partners LLP to any registration requirement within such jurisdiction or country. Persons who access this information are required to inform themselves and to comply with any such restrictions. In particular, this website is exclusively for non-US Persons. The information in this website is not for distribution to and does not constitute an offer to sell or the solicitation of any offer to buy any securities in the United States of America to or for the benefit of US Persons.
This is a marketing document, should be considered non-independent research and is subject to the rules in COBS 12.3 relating to such research. It has not been prepared in accordance with legal requirements designed to promote the independence of investment research.
No representation or warranty, express or implied, is given by any person as to the accuracy or completeness of the information and no responsibility or liability is accepted for the accuracy or sufficiency of any of the information, for any errors, omissions or misstatements, negligent or otherwise. Any views and opinions, whilst given in good faith, are subject to change without notice.
This is not an official confirmation of terms and is not to be taken as advice to take any action in relation to any investment mentioned herein. Any prices or quotations contained herein are indicative only.
Kepler Partners LLP (including its partners, employees and representatives) or a connected person may have positions in or options on the securities detailed in this report, and may buy, sell or offer to purchase or sell such securities from time to time, but will at all times be subject to restrictions imposed by the firm's internal rules. A copy of the firm's conflict of interest policy is available on request.
Past performance is not necessarily a guide to the future. The value of investments can fall as well as rise and you may get back less than you invested when you decide to sell your investments. It is strongly recommended that Independent financial advice should be taken before entering into any financial transaction.
PLEASE SEE ALSO OUR TERMS AND CONDITIONS
Kepler Partners LLP is a limited liability partnership registered in England and Wales at 9/10 Savile Row, London W1S 3PF with registered number OC334771.
Kepler Partners LLP is authorised and regulated by the Financial Conduct Authority.
Kepler Partners is a third-party supplier and not part of interactive investor. Neither Kepler Partners or interactive investor will be responsible for any losses that may be incurred as a result of a trading idea.
These articles are provided for information purposes only. Occasionally, an opinion about whether to buy or sell a specific investment may be provided by third parties. The content is not intended to be a personal recommendation to buy or sell any financial instrument or product, or to adopt any investment strategy as it is not provided based on an assessment of your investing knowledge and experience, your financial situation or your investment objectives. The value of your investments, and the income derived from them, may go down as well as up. You may not get back all the money that you invest. The investments referred to in this article may not be suitable for all investors, and if in doubt, an investor should seek advice from a qualified investment adviser.
Full performance can be found on the company or index summary page on the interactive investor website. Simply click on the company's or index name highlighted in the article.
Important Information
Kepler Partners is not authorised to make recommendations to Retail Clients. This report is based on factual information only, and is solely for information purposes only and any views contained in it must not be construed as investment or tax advice or a recommendation to buy, sell or take any action in relation to any investment.
This report has been issued by Kepler Partners LLP solely for information purposes only and the views contained in it must not be construed as investment or tax advice or a recommendation to buy, sell or take any action in relation to any investment. If you are unclear about any of the information on this website or its suitability for you, please contact your financial or tax adviser, or an independent financial or tax adviser before making any investment or financial decisions.
The information provided on this website is not intended for distribution to, or use by, any person or entity in any jurisdiction or country where such distribution or use would be contrary to law or regulation or which would subject Kepler Partners LLP to any registration requirement within such jurisdiction or country. Persons who access this information are required to inform themselves and to comply with any such restrictions. In particular, this website is exclusively for non-US Persons. The information in this website is not for distribution to and does not constitute an offer to sell or the solicitation of any offer to buy any securities in the United States of America to or for the benefit of US Persons.
This is a marketing document, should be considered non-independent research and is subject to the rules in COBS 12.3 relating to such research. It has not been prepared in accordance with legal requirements designed to promote the independence of investment research.
No representation or warranty, express or implied, is given by any person as to the accuracy or completeness of the information and no responsibility or liability is accepted for the accuracy or sufficiency of any of the information, for any errors, omissions or misstatements, negligent or otherwise. Any views and opinions, whilst given in good faith, are subject to change without notice.
This is not an official confirmation of terms and is not to be taken as advice to take any action in relation to any investment mentioned herein. Any prices or quotations contained herein are indicative only.
Kepler Partners LLP (including its partners, employees and representatives) or a connected person may have positions in or options on the securities detailed in this report, and may buy, sell or offer to purchase or sell such securities from time to time, but will at all times be subject to restrictions imposed by the firm's internal rules. A copy of the firm's conflict of interest policy is available on request.
Past performance is not necessarily a guide to the future. The value of investments can fall as well as rise and you may get back less than you invested when you decide to sell your investments. It is strongly recommended that Independent financial advice should be taken before entering into any financial transaction.
PLEASE SEE ALSO OUR TERMS AND CONDITIONS
Kepler Partners LLP is a limited liability partnership registered in England and Wales at 9/10 Savile Row, London W1S 3PF with registered number OC334771.
Kepler Partners LLP is authorised and regulated by the Financial Conduct Authority.
These articles are provided for information purposes only. Occasionally, an opinion about whether to buy or sell a specific investment may be provided by third parties. The content is not intended to be a personal recommendation to buy or sell any financial instrument or product, or to adopt any investment strategy as it is not provided based on an assessment of your investing knowledge and experience, your financial situation or your investment objectives. The value of your investments, and the income derived from them, may go down as well as up. You may not get back all the money that you invest. The investments referred to in this article may not be suitable for all investors, and if in doubt, an investor should seek advice from a qualified investment adviser.
Full performance can be found on the company or index summary page on the interactive investor website. Simply click on the company's or index name highlighted in the article.