How to see through the market noise and keep your cool
Sure, prices can zig one day and zag the next. And that’s why you need to step back and regain your perspective every once in a while. Here’s a quick to do it.
19th September 2025 10:14
by Reda Farran from Finimize

As Ferris Bueller (nearly) said: “The market moves pretty fast. If you don’t stop and look around once in a while, you could miss it.”
That’s why it’s important to step back from the noise and price swings and see what’s really going on with economic fundamentals and stock valuations.
So, here’s a quick and simple guide to help you do just that.
What key factors should you consider when evaluating valuations in today’s market?
When weighing up US stock valuations, it’s good to use a measure that captures more than just prices relative to earnings. To get a fuller picture, you’ll want to factor in some key economic variables like bond yields and inflation. After all, these have had a huge influence on the market in recent years and are likely to remain major drivers.
Take, for example, the new US administration’s desire to cut corporate taxes even further. And while that could boost companies’ earnings, it would also widen the government deficit and lead to higher bond yields. Those higher yields, in turn, would weigh on stock valuations.
As another example, consider the series of tariffs imposed on US imports this year. These could have a major impact on corporate earnings, depending on how much of those higher underlying costs firms can pass along to customers. Either way, the move could drive up inflation, which has its own implications for the economy and asset valuations. Higher inflation could lead the Federal Reserve (Fed) to pause its interest rate cuts or even reverse them, since the sharpest weapon against an inflation flare-up is higher borrowing costs. Those higher interest rates, in turn, would weigh on stock valuations.
So, what’s the best valuation gauge to use here?
One that particularly stands out to me is the excess cyclically adjusted price-to-earnings (CAPE) yield. It’s a mouthful, sure, but it’s also a handy tool.
This metric has two components: the CAPE itself and its conversion into an excess yield figure. The CAPE is essentially a price-to-earnings (P/E) ratio that’s been smoothed over a broader horizon to account for variations in the business cycle. It compares current stock prices to average earnings over the previous 10 years, adjusted for inflation. This smoothing process makes the CAPE especially useful when analyzing stocks over long periods.
The excess CAPE yield is calculated by inverting the CAPE ratio (1 divided by CAPE) to determine the earnings yield for stocks, then subtracting the real (i.e. inflation-adjusted) 10-year Treasury yield.
Essentially, this metric measures the relative attractiveness of stocks compared to bonds by examining the difference in their real yields. The rationale is simple: stock valuations shouldn’t be viewed in isolation from bonds. Lower bond yields, after all, justify paying more for stocks.
What is the excess CAPE yield today, and what does it mean?
Nobel laureate Robert Shiller – who developed the metric – publishes a monthly updated Excel file with the excess CAPE yield on his website. You can also view it here.
Historically, the higher the excess CAPE yield has been, the better the returns of stocks, relative to bonds, over the following decade. The reverse is also true, as you can see in the chart below.
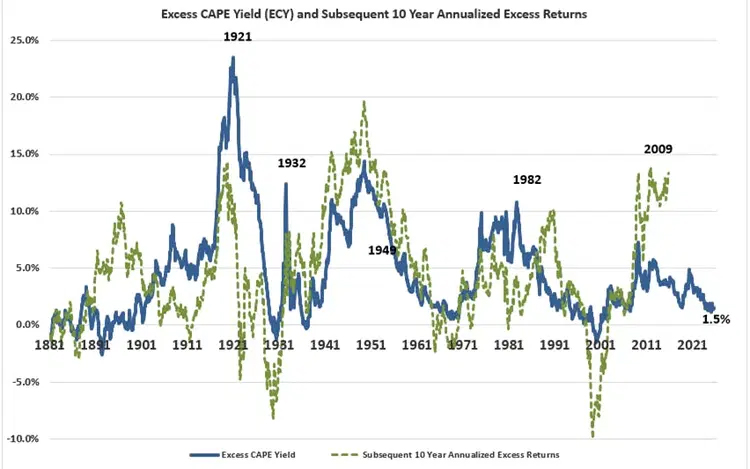
Excess CAPE yield and subsequent 10-year annualized excess returns. Source: Robert Shiller.
And it makes sense: a high excess CAPE yield indicates that stocks are relatively cheaper and more attractive than bonds, which positions them well for future outperformance. Interestingly, the two times when the excess CAPE yield went negative (meaning that stocks were more expensive than bonds) happened just before the Great Crash of 1929 and the dot-com bust in the late 1990s – history’s best two moments to get out of the stock market.
Today, the excess CAPE yield is 1.5%, which is low relative to its nearly 150-year history, sitting in the 24th percentile. And that makes sense considering the S&P 500’s CAPE is currently 38x – one of its highest readings on record – while real bond yields remain slightly elevated compared to recent history.
But, despite being low, the excess CAPE yield is still positive – which suggests that stocks offer better value today than bonds and could outperform over the next decade (if historical trends hold true).
Using Shiller’s dataset, I conducted a linear regression analysis to assess the value of one factor on the other. And based on today’s excess CAPE yield of 1.5%, the model predicted that stocks will outperform bonds by an annualized 2.7% over the next 10 years. That’s not huge, but it’s something. (Mind you, as with all models, you’ll want to take this with a big grain of salt.)
One drawback of the excess CAPE yield calculation, in my opinion, is its approach to calculating the real bond yield. It subtracts the actual annualized inflation rate over the past 10 years from the current 10-year Treasury yield. In other words, it relies on a backward-looking measure of inflation rather than a forward-looking, expected inflation rate.
With that in mind, if we instead use a market-derived measure of real yields, such as the return currently available on 10-year Treasury Inflation-Protected Securities (TIPS), the excess CAPE yield falls to just 1%. In that scenario, stocks don’t look that much more attractive.
So, if you’re invested in a diversified portfolio made up of stocks and bonds, it might be wise to simply hold steady.
Reda Farran is an analyst at finimize.
ii and finimize are both part of Aberdeen.
finimize is a newsletter, app and community providing investing insights for individual investors.
Aberdeen is a global investment company that helps customers plan, save and invest for their future.
These articles are provided for information purposes only. Occasionally, an opinion about whether to buy or sell a specific investment may be provided by third parties. The content is not intended to be a personal recommendation to buy or sell any financial instrument or product, or to adopt any investment strategy as it is not provided based on an assessment of your investing knowledge and experience, your financial situation or your investment objectives. The value of your investments, and the income derived from them, may go down as well as up. You may not get back all the money that you invest. The investments referred to in this article may not be suitable for all investors, and if in doubt, an investor should seek advice from a qualified investment adviser.
Full performance can be found on the company or index summary page on the interactive investor website. Simply click on the company's or index name highlighted in the article.