This indicator has improved returns for dividend investors
Our chart reveals how this indicator has, historically, led to higher share price returns.
31st January 2020 11:00
by Tom Bailey from interactive investor
Our chart reveals how this indicator has, historically, led to higher share price returns.
Interest rates and government bond yields are at historic lows around the world, including in the UK. That doesn’t look likely to change anytime soon.
As a result, investors are hungrier than ever for stocks that provide a solid income through dividend payments. And with the FTSE 100 expected to yield an average 4.7% in 2020, investors are not short of choices.
Robin Geffen, the manager of Liontrust Income fund (and former head of fund group Neptune), however, warns of the risk of chasing the highest yielding stocks. While the yields may be enticing, he argues many look unsustainable, putting investors at risk of losing capital.
Geffen emphasises the need to look at dividend cover, which is considered a key metric to assess whether a company is in a healthy position to distribute dividends. It is calculated by dividing earnings per share (EPS) by the dividend per share (DPS).
As the chart below shows, there has been a correlation between dividend cover and share price performance.
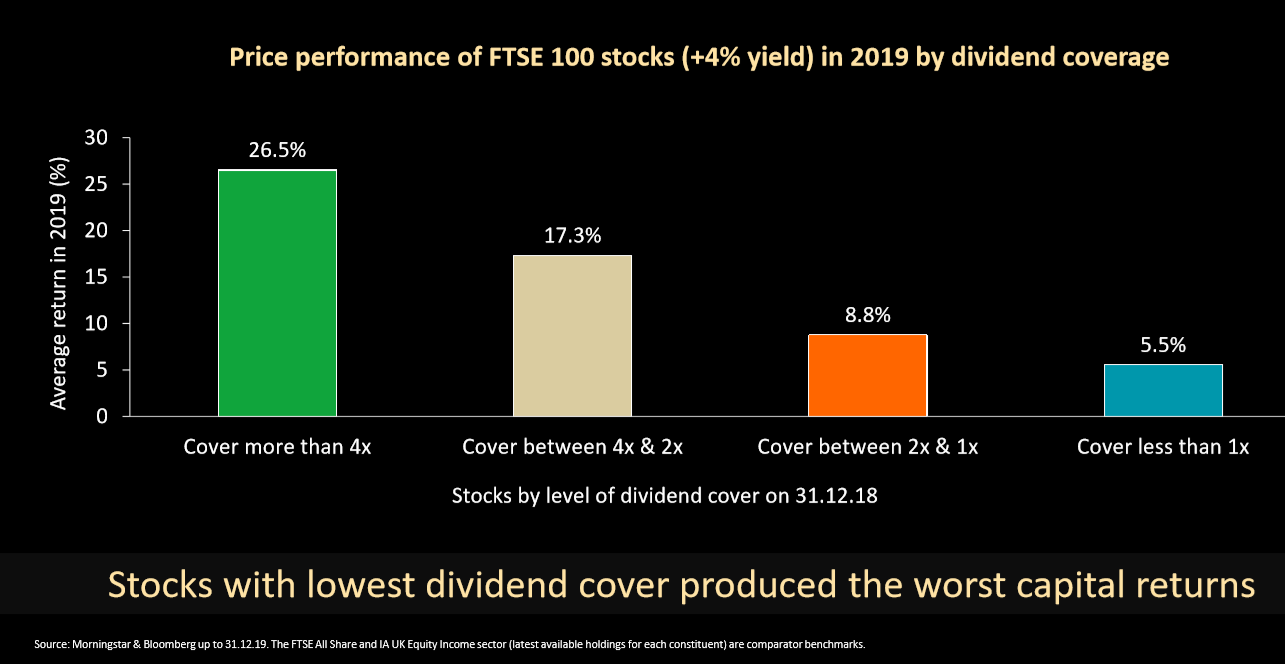
Those with a very high dividend cover score of 4x saw average price returns of 26.5% in 2019. On contrast, those with cover less than 1x saw price rises of just 5.5%.
As a rule of thumb, a low dividend cover ratio – around one times or lower – suggests dividends are vulnerable, as the company is using most if not all of its profits to fund the dividend. A figure of two or more is viewed as comfortable because it is a sign the business is not over-distributing.
Geffen notes that in years markets are more volatile the same pattern rings true – with shares with the lowest dividend cover scores underperforming shares that are in a better financial position to pay dividends. For example, Geffen notes: “In 2018, the biggest losses for capital came from those with low cover.
“A stock with a high yield, but without adequate dividend cover poses a serious risk to an investor’s income and capital.”
He gives the example of Vodafone (LSE:VOD). Geffen says: “Last year it entered 2019 with a dividend yield of 8.6%, but cover of less than 1x. By the first five months of the year, not only had the share price fallen c.20%, but the company had also announced a 40% dividend cut.
“This was a stock we avoided due to its threadbare level of cover, but at the time of the cut, it was held by 66% of funds in the IA UK equity income sector.
Full performance can be found on the company or index summary page on the interactive investor website. Simply click on the company's or index name highlighted in the article.
This article was originally published in our sister magazine Money Observer, which ceased publication in August 2020.
These articles are provided for information purposes only. Occasionally, an opinion about whether to buy or sell a specific investment may be provided by third parties. The content is not intended to be a personal recommendation to buy or sell any financial instrument or product, or to adopt any investment strategy as it is not provided based on an assessment of your investing knowledge and experience, your financial situation or your investment objectives. The value of your investments, and the income derived from them, may go down as well as up. You may not get back all the money that you invest. The investments referred to in this article may not be suitable for all investors, and if in doubt, an investor should seek advice from a qualified investment adviser.
Full performance can be found on the company or index summary page on the interactive investor website. Simply click on the company's or index name highlighted in the article.