Stockwatch: Amazon or Alibaba? Here’s the one I’d buy
Neither company is ridiculously overvalued on numbers alone and both are exposed to technology shifts. But analyst Edmond Jackson has a definite favourite out of these two rivals.
5th September 2025 11:22
by Edmond Jackson from interactive investor
Credit:Thomas Fuller/SOPA Images/LightRocket via Getty Images.
Does a jump in the NYSE-listed shares of Alibaba Group Holding Ltd ADR (NYSE:BABA), due to progress in artificial intelligence (AI), signal a breakout investors should back, or is it more AI hype to be wary of?
- Invest with ii: Buying US Shares in UK ISA | Cashback Offers | Most-traded US Stocks
Alibaba stock shot up over 20% before settling back to a 9% gain at $131 currently, up from $120 just before fiscal first-quarter results to 30 June.
This restores the price to its November 2021 level following a $300 high in October 2020, with a supposedly bullish “bowl” pattern forming since late 2021. Charting advocates might say it was a precursor to this latest rise:
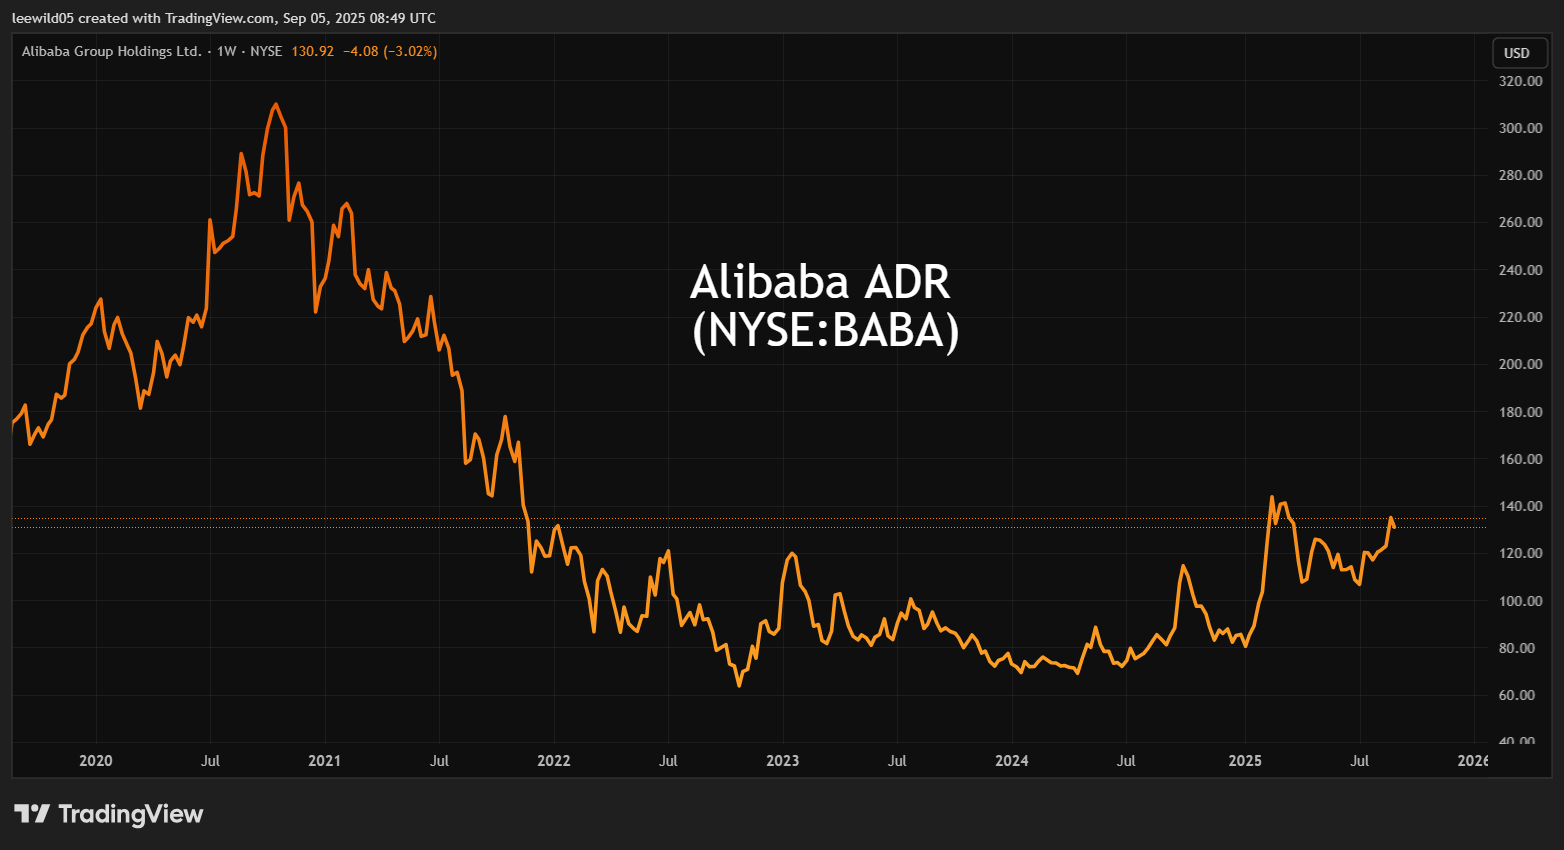
Source: TradingView. Past performance is not a guide to future performance.
While revenue growth of 10% in Q1 to $34.6 billion (£25.7 billion) was slightly below consensus, 26% growth in cloud computing beat expectations for 18%, and there was excitement about a new AI chip designed for tasks such as image recognition and language processing.
One reason that Alibaba has tended to trade on a much lower price/earnings (PE) ratio than Amazon.com Inc (NASDAQ:AMZN) is concern that Alibaba could be subject to Chinese state control. Founder Jack Ma appeared to “go missing” after criticising Chinese regulators in late 2020 and was not properly seen again until March 2023.
- Watch our video: Polar Capital Technology: best and worst AI stocks
- Watch our video: Polar Capital Technology: AI means we’ll outperform the index
But perception may now be shifting, as investors appreciate how Alibaba is well positioned to ride China’s objective for technological self-sufficiency. On 26 August, China’s state council set out its “Artificial Intelligence Plus” initiative to integrate AI deeply across the economy and society. Some £42 billion equivalent is supposedly lined up to help reduce reliance on US chips such as from NVIDIA Corp (NASDAQ:NVDA).
Potentially, it recalls the post-Second World War “Japanese economic miracle, achieved with strong financial and directive support from its ministry of international trade and industry. Since China’s market reforms from 1978, it has seen effective state-driven development compared with past disasters under President Mao.
Lower AI exposure than Amazon but growing rapidly
It appears that Alibaba is attempting a classic Chinese copycat of Amazon, which launched its web services side in 2006 from a base in e-commerce and nowadays provides more than 200 cloud-related services.
By 2024, AWS accounted for 17% of group sales but higher margins meant it generated 58% of operating income. This helps explain why Amazon shares at $235 trade on a trailing PE multiple of around 35x.
By contrast, Alibaba’s cloud segment has just recently represented only 13.5% of group sales but has sustained triple-digit annualised growth for the eighth consecutive quarter. We’re told: “As AI demand continues to grow rapidly, we are also seeing increased demand of compute, storage and other public cloud services to support AI adoption.”
- Stockwatch: does AI justify this cyclical share’s growth rating?
- Sign up to our free newsletter for investment ideas, latest news and award-winning analysis
In terms of underlying profit (EBITDA), however, the cloud represents just 5%, possibly reflecting a current investment phase. Over the past four quarters, Alibaba has invested more than £10 billion equivalent – a 10th of annual sales – in AI infrastructure and AI product R&D.
At group level, Q1 EBITDA fell 11%, said explicitly to be due to increased investments. Similarly, free cash flow was negative owing to investment in cloud infrastructure, and on-demand delivery services, so the main e-commerce side can withstand rising competition.
With end-June cash and short-term investments equivalent to $28.85 billion, or 8.6% of market value, Alibaba is well funded both for its own objectives and to potentially ride on Chinese state initiatives.
Alibaba Group Holdings - summary income statements
Year to 31 March
Renminbi/yuan billions
| 2018 | 2019 | 2020 | 2021 | 2022 | 2023 | 2024 | 2025 | |
| Total revenue | 250 | 377 | 510 | 717 | 853 | 869 | 941 | 996 |
| Cost of revenue | 107 | 207 | 282 | 421 | 539 | 550 | 586 | 598 |
| Gross profit | 143 | 170 | 227 | 296 | 314 | 319 | 355 | 398 |
| Operating expenses | 72.9 | 112 | 134 | 206 | 219 | 216 | 231 | 251 |
| Operating profit | 70.4 | 57.8 | 93.0 | 89.7 | 95.0 | 103 | 124 | 147 |
| Interest expense | 3.6 | 5.2 | 5.2 | 4.5 | 20.6 | 17.0 | 17.9 | 11.1 |
| Other income/expenses | 3.1 | -0.4 | 5.9 | 7.6 | 14.6 | 3.1 | 4.4 | 2.8 |
| Pre-tax profit | 100 | 96.2 | 167 | 166 | 59.6 | 89.2 | 102 | 155 |
| Taxation | 18.2 | 16.6 | 20.6 | 29.3 | 26.8 | 15.5 | 22.5 | 35.4 |
| Continuing operations' profit | 61.4 | 80.2 | 140 | 143 | 62.0 | 72.5 | 79.7 | 129.0 |
| Diluted earnings/share (Yuan) | 24.5 | 33.4 | 55.9 | 54.7 | 22.7 | 27.4 | 31.3 | 51.8 |
A much lower PE than Amazon, plus dividends and buybacks
Alibaba trades on around 16x trailing earnings, easing below 13x on a forward basis, a big disparity versus Amazon’s 35x historic, but obviously with much more to prove by way of earning power from the cloud and AI.
Amazon recently posted better-than-expected second-quarter revenues of around $168 billion, nearly five times greater than Alibaba. AWS achieved 17.5% annualised revenue growth albeit 8.8% in operating income, although it’s unclear whether margin has been ceded versus investments made.
Alibaba makes no reference to a dividend in these latest results, but its 15 May annual results cited a total 25 cents dividend per ordinary share for the past year, costing $4.6 billion. More significantly, $11.9 billion was spent on share buybacks during the financial year which reduced share capital by 5.1%.
Amazon by comparison has not executed a buyback since the second quarter of 2022 and pays no dividends.
This is quite immaterial in a shareholder return context given consensus for Alibaba to pay a $1 per share dividend this financial year would only result in a 0.8% yield. But together with buybacks it helps get the shares on institutional “buy” lists where returns are stipulated.
In terms of total shareholder return, however, Amazon sits pretty having delivered a capital gain of around 2,700x its original 1997 float, with a bull market from single dollar share status up to mid-2011. Despite a Covid lockdown-inspired roller coaster from 2020 to late 2022, it remains globally one of the greatest all-time growth shares.
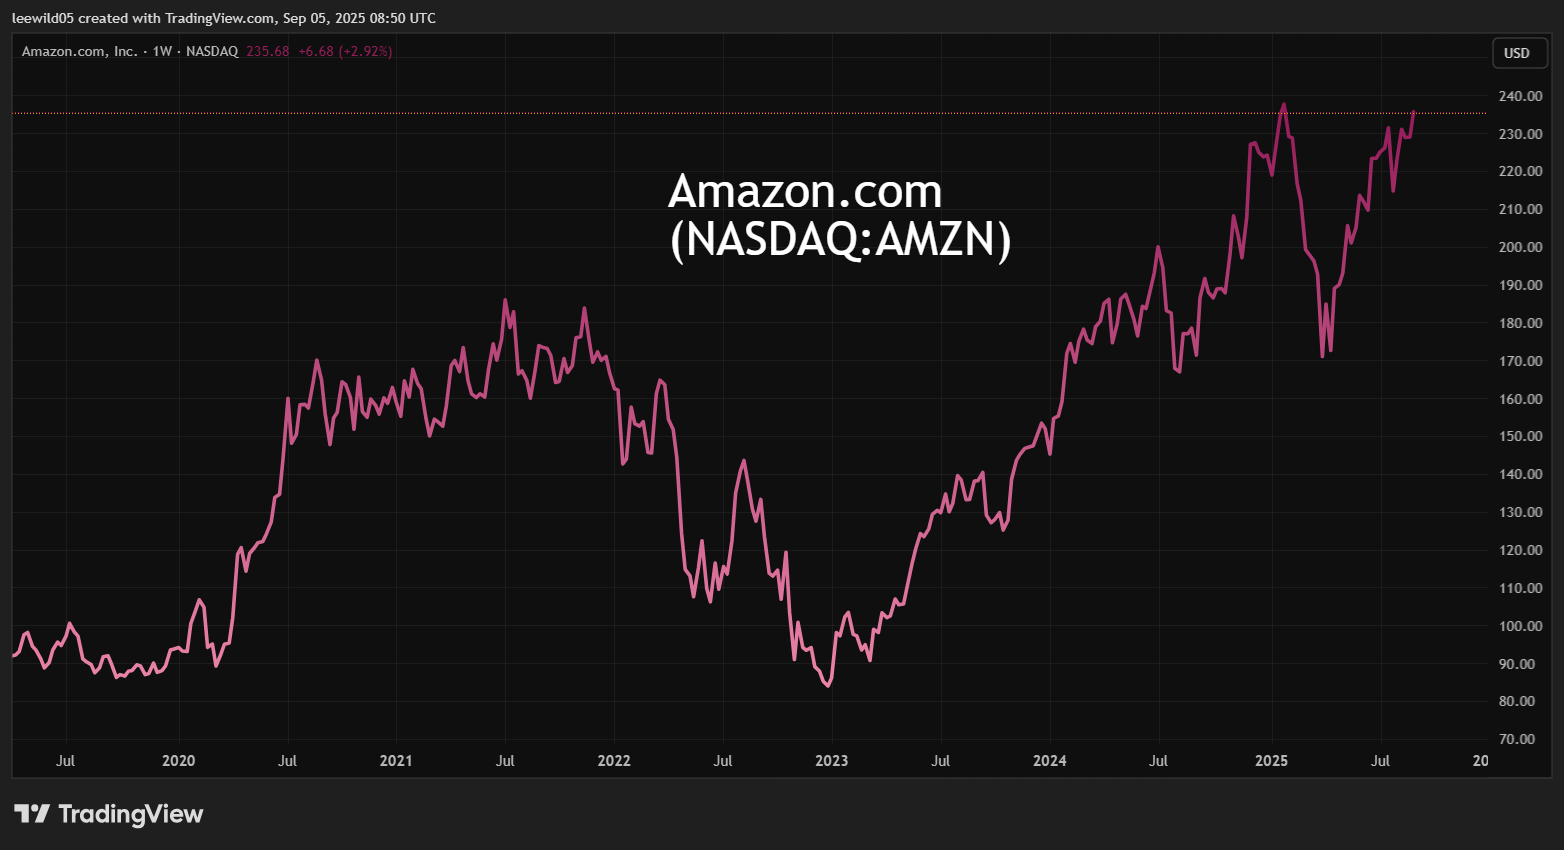
Source: TradingView. Past performance is not a guide to future performance.
I last tipped Amazon in April 2019 at $95 equivalent when its trailing PE was nearly 60x but quarterly profit had more than doubled and a 117% jump in earnings per share (EPS) had beaten expectations by 54%. Performance from AWS had surged as big companies signed up and international expansion was under way. Momentum in cloud was a case of Amazon versus Microsoft Corp (NASDAQ:MSFT).
But examples this year of China rapidly advancing on America in terms of tech capability – especially AI – make me wonder if the next decade will see greater momentum from the East. My second smartphone was Chinese as a test versus the iPhone – and I’ve been plenty pleased and finding it hard to wear down.
A less-impressive record since I covered Alibaba
I initially drew attention to Alibaba at $93 by way of its September 2014 flotation on the NYSE, when Alibaba had only a 10th of Amazon’s revenues albeit a 57% operating margin versus eBay Inc (NASDAQ:EBAY)’s 28% and Amazon’s 1% at the time. While Amazon used to be criticised for buying market share at the expense of profit, this strategy worked out brilliantly.
Alibaba shares rose mainly from 2017, breaching $300 by October 2020 but mean-reverted as low as $60 in October 2022. It nowadays faces increased competition in e-commerce from the likes of Pinduoduo, also listed on the NYSE via its parent PDD Holdings Inc ADR (NASDAQ:PDD). This explains Alibaba’s mixed operating results as it invests in capability to check rivals, whereas Amazon sits with very strong reach in the West, both for goods and web services.
- Where the pros are finding opportunities in shrinking AIM market
- Nestle, Nvidia, Tesla: buy, hold or sell?
Yet in the short to medium term, Alibaba could benefit from China’s economic recovery initiatives, while Amazon faces headwinds from US tariff policies, for example, as it imports goods. US tariffs could obviously be a general dampener on China. It is also hard to track Alibaba’s US revenues, given tht they are consolidated as global revenue from its Chinese operations. If you seek better investment certainty, steer clear of both.
Alibaba trades on around 2.2x sales versus 3.2x for Amazon where both can be seen as quite expensive for such a trade context but it looks justified given they are prime East and West examples for AI exposure. Moreover, they are not ridiculously overvalued on numbers alone and exposed to technology shifts as a pure AI share might be.
Considering Alibaba has just a 4% share of the global cloud market versus AWS with 30%, and Microsoft with 20%, it can be regarded either as a minority player or with scope to leverage, especially in Asia-Pacific.
I still favour Alibaba over Amazon as a ‘buy’
Possibly I am swayed by a “Jason vs Goliath” idea, plus a long-standing sense of how the Asia-Pacific region is dynamic. My first investment was a Japanese technology trust in 1983. I suspect Alibaba shares will remain volatile, and we should not over-react to this modest re-rate. But on a five to 10-year view, and in terms of choice as a “buy”, I favour Alibaba for relative growth potential and more appealing valuation. I rate Amazon a “hold” in respect of its global cloud leadership.
Edmond Jackson is a freelance contributor and not a direct employee of interactive investor.
These articles are provided for information purposes only. Occasionally, an opinion about whether to buy or sell a specific investment may be provided by third parties. The content is not intended to be a personal recommendation to buy or sell any financial instrument or product, or to adopt any investment strategy as it is not provided based on an assessment of your investing knowledge and experience, your financial situation or your investment objectives. The value of your investments, and the income derived from them, may go down as well as up. You may not get back all the money that you invest. The investments referred to in this article may not be suitable for all investors, and if in doubt, an investor should seek advice from a qualified investment adviser.
Full performance can be found on the company or index summary page on the interactive investor website. Simply click on the company's or index name highlighted in the article.
Disclosure
We use a combination of fundamental and technical analysis in forming our view as to the valuation and prospects of an investment. Where relevant we have set out those particular matters we think are important in the above article, but further detail can be found here.
Please note that our article on this investment should not be considered to be a regular publication.
Details of all recommendations issued by ii during the previous 12-month period can be found here.
ii adheres to a strict code of conduct. Contributors may hold shares or have other interests in companies included in these portfolios, which could create a conflict of interests. Contributors intending to write about any financial instruments in which they have an interest are required to disclose such interest to ii and in the article itself. ii will at all times consider whether such interest impairs the objectivity of the recommendation.
In addition, individuals involved in the production of investment articles are subject to a personal account dealing restriction, which prevents them from placing a transaction in the specified instrument(s) for a period before and for five working days after such publication. This is to avoid personal interests conflicting with the interests of the recipients of those investment articles.