Three key trends to help analyse FTSE 100
As we move closer to election day, our chartist breaks down trends in order to gain a clearer picture.
6th December 2019 09:35
by Alistair Strang from Trends and Targets
As we move closer to election day, our chartist breaks down trends in order to gain a clearer picture.

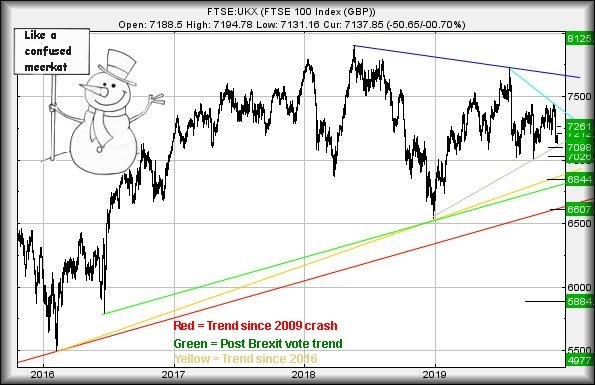
Next, we need to review the uptrend (yellow) since the start of 2016 and it's at 6,875 points.
Finally, we've got the uptrend (green) since the Brexit vote, presently lurking at 6,816 points.
Armed with the above three numbers, we can decide if the UK stock market is on the verge of collapse.
As it's presently at 7,137, the answer is clearly no, despite suffering a pretty grotty week. The usual suspects can be blamed, the three 'B's. Boris, Brexit, and Mr Trump.
Fans of chart patterns will have noted the head and shoulders formation on the FTSE 100 during this year.
Conventional arithmetic attributed to this pattern suggests the market should relax to 6,607 points.
This risks breaking all three major trends, causing a rush for clean underwear. Presently, there is very little making such a drop inevitable. Below 7,000 points would certainly justify some panic though.
However, we do have concerns, thanks to recent movements.
At present, weakness now below 7,130 points risks reversal to an initial 7,098 points.
If broken, secondary calculates at 7,026 points. Even visually, there are several reasons to anticipate a rebound, should 7,026 appear.
With an election approaching and a fear of "the wrong result", travel down to such a level makes a lot of sense prior to the vote.
In the event this 7,026 drop target appears and opting for a blind "long" position, stop needs be pretty wide at 6,950 points.
There's an issue, should 6,950 break. This would imply a further trip down to 6,844 and probable rebound against the Brexit vote uptrend in green.
Additionally, we need consider another factor.
Writing about market movements, tossing in loads of numbers, risks utter confusion to the reader as it certainly provokes "number blindness" in the writer.
Therefore, with this excellent excuse to pause for a cup of tea, shall return in a moment...
Now armed with a fresh cup of tea, obviously rarely do things move in an utterly straight line, resulting in the scenario of anything near-term above 7,181 allegedly being capable of triggering recovery to an initial 7,212 points.
If exceeded, secondary calculates at a more interesting 7,261 points. If triggered, the tightest stop is horribly wide at 7,131 points.
Have a good weekend.
Source: Trends and Targets Past performance is not a guide to future performance
Alistair Strang has led high-profile and "top secret" software projects since the late 1970s and won the original John Logie Baird Award for inventors and innovators. After the financial crash, he wanted to know "how it worked" with a view to mimicking existing trading formulas and predicting what was coming next. His results speak for themselves as he continually refines the methodology.
Alistair Strang is a freelance contributor and not a direct employee of Interactive Investor. All correspondence is with Alistair Strang, who for these purposes is deemed a third-party supplier. Buying, selling and investing in shares is not without risk. Market and company movement will affect your performance and you may get back less than you invest. Neither Alistair Strang, or interactive investor will be responsible for any losses that may be incurred as a result of following a trading idea.
Alistair Strang has led high-profile and "top secret" software projects since the late 1970s and won the original John Logie Baird Award for inventors and innovators. After the financial crash, he wanted to know "how it worked" with a view to mimicking existing trading formulas and predicting what was coming next. His results speak for themselves as he continually refines the methodology.
Alistair Strang is a freelance contributor and not a direct employee of Interactive Investor. All correspondence is with Alistair Strang, who for these purposes is deemed a third-party supplier. Buying, selling and investing in shares is not without risk. Market and company movement will affect your performance and you may get back less than you invest. Neither Alistair Strang or Interactive Investor will be responsible for any losses that may be incurred as a result of following a trading idea.
These articles are provided for information purposes only. Occasionally, an opinion about whether to buy or sell a specific investment may be provided by third parties. The content is not intended to be a personal recommendation to buy or sell any financial instrument or product, or to adopt any investment strategy as it is not provided based on an assessment of your investing knowledge and experience, your financial situation or your investment objectives. The value of your investments, and the income derived from them, may go down as well as up. You may not get back all the money that you invest. The investments referred to in this article may not be suitable for all investors, and if in doubt, an investor should seek advice from a qualified investment adviser.
Full performance can be found on the company or index summary page on the interactive investor website. Simply click on the company's or index name highlighted in the article.