Understanding spikes: A Sirius Minerals case study
Our chartist takes a look at this trading concept using Sirius Minerals. He also analyses the FTSE 100.
26th April 2019 09:10
by Alistair Strang from Trends and Targets
Our chartist takes a look at this trading concept using Sirius Minerals. He also analyses potential movements for the FTSE 100.

Sirius Minerals (SXX) and FTSE for Friday (FTSE:UKX)
The markets evolve, causing us to evolve with them and constantly change our approach to future analysis. There are a few market ploys which remain constant (and despised), some movement ploys take a holiday for a year or two, and some new strategy appearing too.
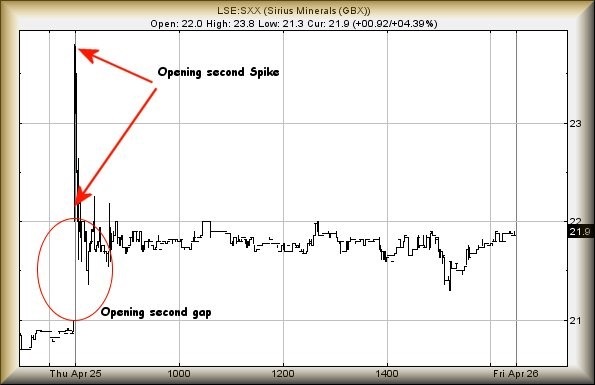
Our most hated trading ploy is the spike. At the open of trade a share price will spike up or down, generally to one of our target levels. This price movement is usually untradeable unless the investor had the foresight to place an order.
Worse, an upward spike is generally the harbinger for coming downward movement whereas the converse is true with a downward spike. The whole thing makes little sense and the waters become muddied, when a trading spike is combined with a price manipulation gap.
Logic implies a "gap up" is the market attempting to impart energy for some future gains on a price. But a spike up implies a price is about to fall. Sirius Minerals (LSE:SXX) managed to step forward and fill the poisonous chalice on the 24th April.
Based on the numbers alone, Sirius experienced quite a vibrant day for the share price, a trading range of 2.5p - 11.42% bandwidth. Unfortunately, a glance at what actually happened tells quite a different story.
Three minutes after trading opened for the day, very little happened. The optimists, probably glued to their screens from 8am, doubtless lost interest around lunchtime, painfully aware they'd been fed a teaser.
We're also completely uncertain, due to the strategy of using two different indicators. Our gut feeling is Sirius shall fall toward 19p again, prior to a rebound. But we're also trying to ignore that it closed at a "higher high (by just 0.04p)" than last time, something supposed to provide optimism.
Source: Trends and Targets Past performance is not a guide to future performance
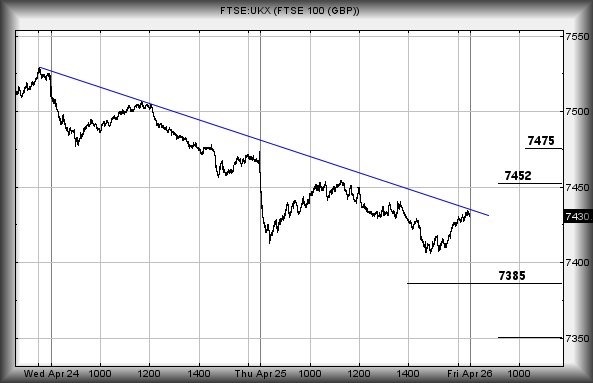
As for the FTSE 100 index for Friday, the market did something which (from our viewpoint) was quite interesting on Thursday by achieving a low of 7,405 points.
We've some mathematical mumbo jumbo around this figure but, in plain English, below 7,405 should indicate near-term weakness coming to 7,385 points. If broken, our secondary is at 7,350 points.
The UK index achieved a fairly stage managed reversal during the last couple of sessions, one which promises above 7,436 points at the open on Friday shall imply the reversal is complete and some recovery to 7,452 can be anticipated.
If bettered, secondary calculates at 7,475 points.
We're actually not comfortable that the pristine blue downtrend actually means anything, instead suspecting the FTSE is liable to spend Friday hitting the 7,452 level, then reverse yet again with 7,385 making an appearance if any negative news appears.
On the bright side, Easter is thankfully over and we've absolutely no chocolate remaining in the office. I know, I searched - several times!
Source: Trends and Targets Past performance is not a guide to future performance
Alistair Strang has led high-profile and "top secret" software projects since the late 1970s and won the original John Logie Baird Award for inventors and innovators. After the financial crash, he wanted to know "how it worked" with a view to mimicking existing trading formulas and predicting what was coming next. His results speak for themselves as he continually refines the methodology.
Alistair Strang is a freelance contributor and not a direct employee of Interactive Investor. All correspondence is with Alistair Strang, who for these purposes is deemed a third-party supplier. Buying, selling and investing in shares is not without risk. Market and company movement will affect your performance and you may get back less than you invest. Neither Alistair Strang or Interactive Investor will be responsible for any losses that may be incurred as a result of following a trading idea.
These articles are provided for information purposes only. Occasionally, an opinion about whether to buy or sell a specific investment may be provided by third parties. The content is not intended to be a personal recommendation to buy or sell any financial instrument or product, or to adopt any investment strategy as it is not provided based on an assessment of your investing knowledge and experience, your financial situation or your investment objectives. The value of your investments, and the income derived from them, may go down as well as up. You may not get back all the money that you invest. The investments referred to in this article may not be suitable for all investors, and if in doubt, an investor should seek advice from a qualified investment adviser.
Full performance can be found on the company or index summary page on the interactive investor website. Simply click on the company's or index name highlighted in the article.