Will BP's share price continue its recovery?
10th June 2021 08:10
by Alistair Strang from Trends and Targets
This technical analyst believes we may have witnessed an early warning for some proper price action at BP.
For BP (LSE:BP.), it’s always worth remembering the thick red line on the chart below. While we’d like to ridicule a trend line 30 years old, share price movements tend to suggest the market is perfectly aware of this splash of colour on the chart.
It creates a trading environment where the share price's ‘ultimate bottom’ computes down at 29p and, thanks to this calculation, share price drops can easily outperform with some dreadful amateur dramatics.
Our inclination is to believe the market shall become aware of this danger, hopefully opting to enact some panic recovery as is so often the case with such things. Given the current boost to crude oil prices, surely it’s about time oiler share prices started to enjoy the benefits of increased sale values too?
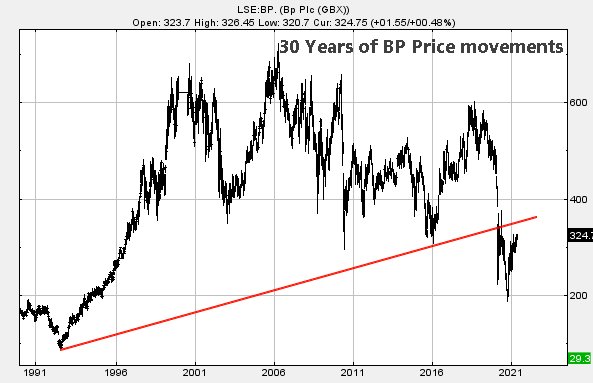
Source: Trends and Targets. Past performance is not a guide to future performance
With this in mind, something about recent share price movements is worth a glance. Despite our expectation of being negative on future prospects, BP has built itself a little glass ceiling in the last year at 324p and we notice that the share price has finally closed a session above this level at 324.75p. While perhaps not the most significant of movements, we’re always inclined toward optimism when a share is permitted to break a glass ceiling.
In the case of BP, as the chart below highlights, it’s perhaps an early warning for some proper price action.
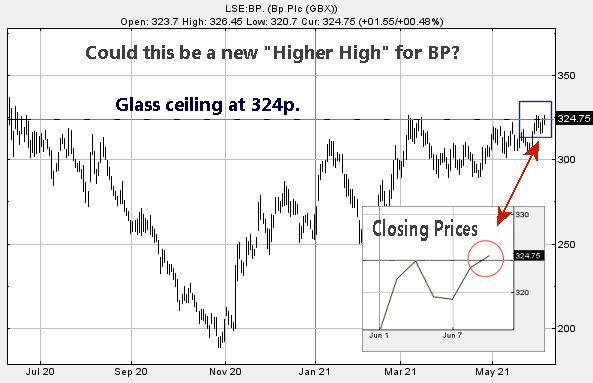
Source: Trends and Targets. Past performance is not a guide to future performance
Finally, we reach the part of the story where we must run some calculations for the long term. If the price movement yesterday was indeed an early warning for happier times, we need to explore whether recovery above the long-term Red uptrend is a viable ambition. Equally, should we anticipate action which reflects the immediate Blue downtrend since 2019?
It appears the answer to both questions should be “Yes”.
Near-term trades bettering just 330p should make recovery difficult to restrain as we’re calculating the potential of movement to an initial 369p. As shown below, this will marginally take the price above Red on the chart and into a zone of illusory safety.
We’d hope our initial calculation would be exceeded with this scenario, making our longer-term secondary target of 430p an extremely viable ambition. Movement beyond such a level starts to produce some surprising targets, the first of which works out at 516p and challenging the price highs prior to the pandemic hitting the fan.
Finally, there is an aspect of BP’s dance steps over the last 18 months which is worthy of additional consideration.
We’ve drawn a pretty circle on the chart below. Our idea of perfection would come, if the market somehow found sufficient excuse to “Gap Up” the share price at some point soon. This will create a “Gap Down/Gap Up” picture, a game plan which should make BP a perfect candidate for a hold, just to see how high the price intends go. It’s a thought!
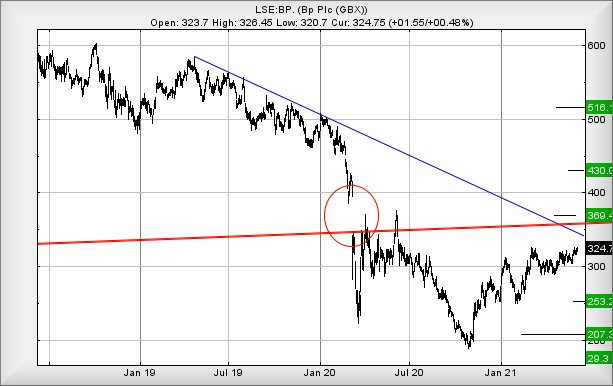
Source: Trends and Targets. Past performance is not a guide to future performance
Alistair Strang has led high-profile and "top secret" software projects since the late 1970s and won the original John Logie Baird Award for inventors and innovators. After the financial crash, he wanted to know "how it worked" with a view to mimicking existing trading formulas and predicting what was coming next. His results speak for themselves as he continually refines the methodology.
Alistair Strang is a freelance contributor and not a direct employee of Interactive Investor. All correspondence is with Alistair Strang, who for these purposes is deemed a third-party supplier. Buying, selling and investing in shares is not without risk. Market and company movement will affect your performance and you may get back less than you invest. Neither Alistair Strang or Interactive Investor will be responsible for any losses that may be incurred as a result of following a trading idea.
These articles are provided for information purposes only. Occasionally, an opinion about whether to buy or sell a specific investment may be provided by third parties. The content is not intended to be a personal recommendation to buy or sell any financial instrument or product, or to adopt any investment strategy as it is not provided based on an assessment of your investing knowledge and experience, your financial situation or your investment objectives. The value of your investments, and the income derived from them, may go down as well as up. You may not get back all the money that you invest. The investments referred to in this article may not be suitable for all investors, and if in doubt, an investor should seek advice from a qualified investment adviser.
Full performance can be found on the company or index summary page on the interactive investor website. Simply click on the company's or index name highlighted in the article.