10 trusts crowned quarter-century champions
After 25 years of crises and recoveries, Kepler reveals the best performers, and the growth of a hypothetical £10,000, showing that time in the market, not timing is paramount.
12th September 2025 14:03

This content is provided by Kepler Trust Intelligence, an investment trust focused website for private and professional investors. Kepler Trust Intelligence is a third-party supplier and not part of interactive investor. It is provided for information only and does not constitute a personal recommendation.
Material produced by Kepler Trust Intelligence should be considered a marketing communication, and is not independent research.
The ancient Greeks spoke of time not as a single thread but as a tapestry woven from distinct strands. Chronos marked the steady, sequential passage of time, the ticking clock, the turning calendar. In contrast, Kairos captured the fleeting moment of opportunity, the instant when action could change everything.
For investors, it is Chronos that proves the most powerful ally: not sudden fortune or the impossibility of perfect market timing, but the quiet, relentless march of time that allows compounding to work its magic. That principle underpins this article, as we look back at investment trust performance since the turn of the millennium, highlighting the top performers and the factors behind their long-term success.
The quarter-century champions
Over the past quarter of a century (to August 2025) a handful of trusts have turned invested capital into extraordinary outcomes, although likely not without testing the conviction of those who held them. Investors endured the dotcom collapse, the global financial crisis, the pandemic crash and the sharpest rise in inflation and interest rates in a generation. Yet the closed-ended structure of trusts, freeing managers from redemption pressures, allowed strategies to play out through thick and thin. Compounding did the rest.
So, which names rose to the top? After 25 years of crises and recoveries, here are the 10 best performers ranked by share price total return, alongside the growth of a hypothetical £10,000 investment in both nominal and real growth (inflation-adjusted) terms.
All performance and risk metrics throughout are based on share price returns to reflect actual investor experience; where NAV data is used, it is clearly noted. Importantly, every trust in the top 10 not only delivered substantial absolute gains and real growth over inflation but also comfortably outpaced both the FTSE All-Share and FTSE World indices, underlining the scale of value created.
TOP-PERFORMING INVESTMENT TRUSTS
| Trust | Sector | Cumulative SP return (%) | Annualised SP return (%) | 10k ending value (£) | Real growth over inflation (£) |
| HgCapital Trust Ord (LSE:HGT) | Private Equity | 3,255 | 14.7 | 335,503 | 181,353 |
| abrdn Asia Focus plc (LSE:AAS) | Asia Pacific Smaller Companies | 2,779 | 14 | 287,978 | 155,664 |
| Scottish Oriental Smaller Cos Ord (LSE:SST) | Asia Pacific Smaller Companies | 2,474 | 13.5 | 257,487 | 139,182 |
| 3i Group Ord (LSE:III) | Private Equity | 2,435 | 13.4 | 253,581 | 137,071 |
| Fidelity Special Values Ord (LSE:FSV) | UK All Companies | 1,642 | 11.8 | 174,239 | 94,183 |
| Worldwide Healthcare Ord (LSE:WWH) | Biotechnology & Healthcare | 1,637 | 11.8 | 173,695 | 93,889 |
| Pacific Horizon Ord (LSE:PHI) | Asia Pacific | 1,624 | 11.7 | 172,399 | 93,189 |
| Scottish Mortgage Ord (LSE:SMT) | Global | 1,528 | 11.5 | 162,862 | 88,033 |
| Fidelity European Trust Ord (LSE:FEV) | Europe | 1,277 | 10.8 | 137,790 | 74,481 |
| BlackRock World Mining Trust Ord (LSE:BRWM) | Commodities & Natural Resources | 1,265 | 10.7 | 136,593 | 73,834 |
| FTSE World Index | 552 | 7.6 | 65,211 | 35,249 | |
| FTSE All-Share Index | 272 | 5.3 | 37,193 | 20,104 | |
Source: Morningstar, 01/01/2000 to 31/08/2025. Past performance is not a reliable indicator of future results
At the summit sitsHgCapital Trust Ord (LSE:HGT), a private equity specialist that delivered an annualised return of 14.7%. Put another way: £10,000 left untouched through all those market upheavals would today be worth almost £340,000 (£335,503 to be exact), or around £181,000 in real terms after adjusting for inflation.
While the gap between nominal and real returns is striking, that £181,000 still represents a remarkable level of inflation-beating wealth creation. Compare that with a savings account where interest often lagged inflation, the difference between merely treading water and growing purchasing power becomes clear.
Following HGT, the table offers a diverse mix: Asian smaller company specialists abrdn Asia Focus plc (LSE:AAS)and Scottish Oriental Smaller Cos Ord (LSE:SST); another private equity heavyweight in 3i Group Ord (LSE:III); and a contrarian UK play in Fidelity Special Values Ord (LSE:FSV). Beyond them, healthcare, technology, commodities and European equities all feature, reminding us that long-term success is not tied to a single theme. Let’s take a closer look at the top five.
Private equity makes the podium…twice
Two private equity trusts feature in the 25-year podium, delivering outsized long-term returns. Their success stems from disciplined entry at attractive valuations, active value creation through operational change, bolt-on acquisitions and governance improvements, and well-timed exits capturing both earnings growth and multiple expansion. Structural tailwinds have helped: the expansion of private markets, growing demand for specialist operators and the illiquidity premium.
Listed private equity trusts also benefit from permanent capital structures, allowing patient ownership and the ability to hold winners as the thesis plays out without forced selling. But this value-creation engine is cyclical. Returns are supercharged when debt is cheap, credit is abundant and economies are expanding, but slow when borrowing costs spike, credit tightens, or recessions erode portfolio revenues and reset valuations. That can make returns lumpy, with investors experiencing bouts of volatility.
Not all journeys, however, have been defined by sharp swings. HGT has charted a comparatively steady course compared to most peers. Its focussed strategy of backing private European technology and software businesses, companies typically with high recurring revenues, strong margins and enduring productivity trends, has proved resilient. Many meet the managers’ ‘rule of 40’ test, where growth plus margins exceed 40%, enabling earnings to compound through cycles. As such, HGT’s share price total return has been exceptional, hitting 14.7% per annum over 25 years and leading the field.
But that’s not the whole story. Long-term returns may look compelling on paper, yet the path to achieving them is rarely smooth. That’s why, throughout this piece, we’ve also considered measures of volatility, such as maximum drawdown or annualised volatility, to give context to the intra-year swings investors faced. Whilst volatility may wash out over the very long run, its psychological impact can be decisive. Would you have held on through a 40% market fall during the dotcom crash, let alone hold for the next 25 years? For some, the temptation to lock in gains, or crystallise losses to avoid further pain, would have been hard to resist.
Consequently, we compared HGT’s volatility with the wider listed private equity sector over the past 15 years, as most peers lack 25-year track records, covering its standard deviation and maximum drawdown. Even on this basis, HGT stands out. Its maximum drawdown of –24.1% was the lowest in the group, whilst its standard deviation was the third lowest, demonstrating strong downside resilience and comparatively steady performance through market fluctuations. These metrics, based on share price not NAV, reflect actual investor experience.
HGT VERSUS PRIVATE EQUITY PEER GROUP
| PE trusts | Standard deviation (Annualised %) | Max drawdown (%) |
| JPEL Private Equity Ord (LSE:JPEL) | 15.6 | -55.5 |
| HarbourVest Global Priv Equity Ord (LSE:HVPE) | 16.8 | -28.6 |
| HgCapital Trust Ord (LSE:HGT) | 16.9 | -24.1 |
| Partners Group Private Equity Ord (LSE:PEY) | 17.6 | -39.6 |
| Pantheon International Ord (LSE:PIN) | 18.3 | -34.8 |
| ICG Enterprise Trust Ord (LSE:ICGT) | 18.6 | -33.5 |
| Oakley Capital Investments Ord (LSE:OCI) | 18.7 | -33.1 |
| Patria Private Equity Trust (LSE:PPET) | 20.2 | -34.4 |
| NB Private Equity Partners Class A Ord (LSE:NBPE) | 20.5 | -43.5 |
| CT Private Equity Trust Ord (LSE:CTPE) | 21.3 | -31.9 |
| 3i Group Ord (LSE:III) | 25.3 | -45.6 |
| JZ Capital Partners Ord (LSE:JZCP) | 31.8 | -86.4 |
| Peer group simple average | 20.1 | -40.9 |
Source: Morningstar, 01/09/2010 to 31/08/2025. Past performance is not a reliable indicator of future results.
At the portfolio level, HGT’s NAV growth over the quarter century has been equally impressive, compounding at 13.8% annually, the best in its peer group. That consistency has underpinned confidence, helping narrow discounts and support share price compounding over time. Risks remain though. Valuations in software remain demanding, with the top 20 holdings currently valued at more than 26× EBITDA, and gearing is relatively high. A significant earnings slowdown or sustained borrowing costs could also weigh on performance. But its record of realisations at premiums and specialist expertise continue to support the case.
III, by contrast, has followed a far bumpier path. Ranked fourth overall with 13.4% annualised share price returns over 25 years, which equates to nominal growth of £253,581 or real growth to £137,071, its performance has been shaped by a mix of evergreen ownership, realised exits and a growing asset-management arm. Yet its concentrated portfolio and distinctive style contributed to some of the highest volatility and drawdowns in the group. Gains were uneven, with the bulk of returns delivered only in the last 10 – 15 years.
The pivotal turning point was its 2011 acquisition of Action, a large discount retailer, that has since become its crown jewel. And from 2013 onwards, III’s NAV growth accelerated and sentiment improved, narrowing the discount and propelling share price returns. The contrast with earlier years is stark: between 2000 and 2011, III’s NAV rose 46% but the share price barely moved (+3.4%), reflecting a persistently wide discount. Since the Action deal, share price returns have surged 2,352.8%, supported by NAV growth of 1,263.9%. Together, these gains account for almost the entirety of its 25-year share price return of 2,435.8% (13.4% annualised).
Action has clearly done the heavy lifting, contributing to the majority of III’s returns. That said, the managers have done well elsewhere, notably in their 30% stake in 3i infrastructure (3IN) and its two public private partnership funds, which have provided steadier income streams and helped diversify the portfolio beyond pure private equity.
3I GROUP PERFORMANCE PROFILE
| 01/01/2000 to 31/07/2011 | 01/08/2011 to 31/08/2025 | Whole 25yr period | SP return annualised | |
| III share price return | 3.40% | 2352.80% | 2435.80% | 13.40% |
Source: Morningstar. Past performance is not a reliable indicator of future results.
The lesson is clear: long-term outperformance rarely follows a straight line. While HGT delivered steady compounding, III rewarded patience only after a long fallow period, when NAV growth finally translated into a re-rating. Those willing to weather the fluctuations will have received substantial reward.
Strength in smaller companies
Another recurring theme among the top performers is exposure to Asia smaller companies, where two of the top five podium spots are held by small-cap specialists. Smaller businesses can often compound earnings rapidly from a low base, and active managers can add value through concentrated stock selection, long holding periods and a willingness to back management teams through inflection points. This combination can deliver powerful compounding when sectoral tailwinds or cyclical recoveries arrive, though the same concentration and growth bias leaves small-caps more vulnerable in economic downturns or during liquidity stress.
The dynamics of Asian small-caps are clear when comparing long-term relative returns to the MSCI ACWI Large Cap Index of global equities. Over the full 25-year period, the MSCI AC Asia ex Japan Small Cap Index has comfortably outpaced the global large-cap benchmark, yet the path has been far from smooth and at times it has given back all its relative gains. Small-caps rallied strongly leading into the 2008 global financial crisis, fell sharply during the downturn, and then recovered through to 2012. Since then, performance has been more uneven, with sporadic periods of strength, including the last 12 months, reflecting factors such as trade tensions, tighter financial conditions, and episodic risk-off sentiment. Despite these swings, the structural growth potential of smaller companies has rewarded patient investors over the long term.
ASIAN SMALL-CAP VERSUS LARGE-CAP PERFORMANCE
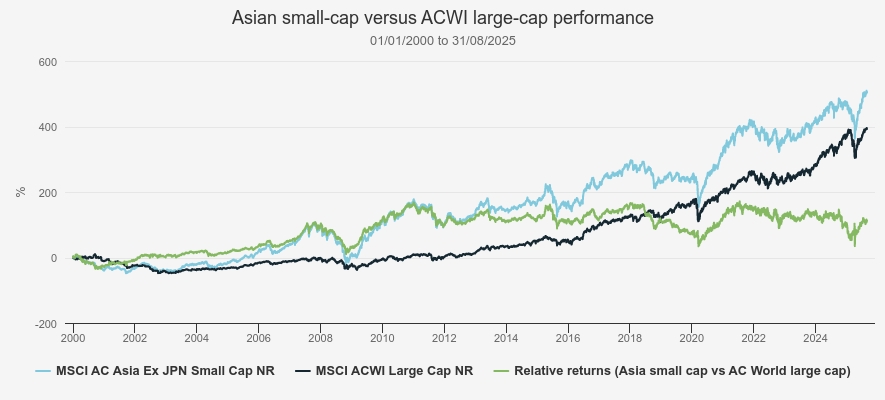
Source: Morningstar. Past performance is not a reliable indicator of future results
This backdrop sets the scene for AAS and SST, two trusts that exemplify disciplined, conviction-driven approaches within Asian smaller companies that have seen a large part of their returns come strongly during those periods when small-caps have been in favour. AAS ranks second overall, delivering 13.9% annualised share-price returns, equating to real growth to £155,664, with relatively low volatility (standard deviation of 15.9%). Its strategy consistently targets high-quality Asian growth stories across domestic consumption, technology supply chains and financial modernisation. By holding through volatility, the managers have been able to capture structural opportunities with the potential to become tomorrow’s corporate leaders, reflected in its strong long-term performance.
SST tells a similar story, ranking third with 13.5% annualised returns, equating to real growth to £139,182 real growth adjusting for inflation, and a standard deviation of 16.2%. Its mandate emphasises undervalued domestic franchises, governance turnarounds, and dividend restoration opportunities overlooked by larger managers. This positioning has allowed it to thrive during small-cap rallies whilst maintaining resilience through tougher stretches.
Whilst both trusts have benefitted from long-term managers who stick to a bottom-up approach where stock picking is the primary driver of returns, there have been periods of struggle. For instance, since 2020, Asian small-caps have faced geopolitical tensions, pandemic disruption, inflation spikes and aggressive rate hikes, conditions that often drive investors towards large-caps or defensive assets.
The past five years illustrate this. AAS delivered strong gains in 2021 and 2024, despite a sharp decline in 2022 when risk appetite collapsed amid rising rates and the Ukraine war. SST posted double-digit returns in 2024 and remained positive in 2022, when small-caps broadly struggled, though it missed out on the booming 2020 rally. These are conditions that often drive investors towards large-caps or defensive assets, but both AAS and SST have shown the ability to rebound strongly when sentiment turns, which has supported long-term performance.
AAS AND SST CALENDAR YEAR PERFORMANCE
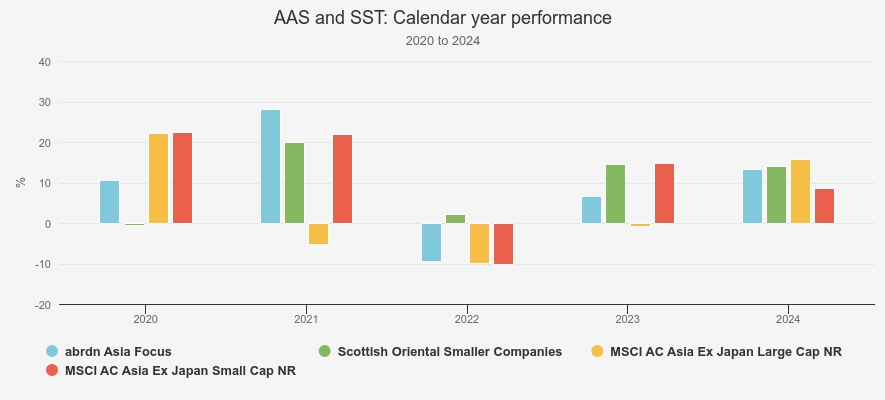
Source: Morningstar. Past performance is not a reliable indicator of future results
While small-caps are more exposed to liquidity stress and risk-off sentiment, high-quality, concentrated portfolios can cushion the blows and capture rebounds. For patient investors, AAS and SST demonstrate how disciplined active management can harness Asia’s dynamic small-cap opportunity set for long-term compounding.
A contrarian surprise in the top five
Perhaps the most surprising entrant in the top five is Fidelity Special Values, a vehicle investing in the UK market, recently branded as boring, lacking growth, or overshadowed by the dynamism of US technology. Yet FSV has delivered an annualised share price return of 11.8%, or real growth of £94,183, over the 25 years. Notably, no US-focussed trusts feature among the top performers, underscoring how compounding can work its magic, delivering powerful long-term outcomes even in unloved markets.
Broader context helps explain this. In the early 2000s, the FTSE 250, often considered the UK’s growth market, outperformed many global peers, offering compelling opportunities for domestic investors. One useful comparison is with the S&P 500, which highlights how UK mid-caps provided periods of stronger relative growth prior to the GFC and until around 2018 underscoring how compelling these domestic mid-cap opportunities were at the time. Since then, relative returns have fallen by the wayside, as shown by the downwards relative return line in the chart below.
FTSE 250 VERSUS S&P 500
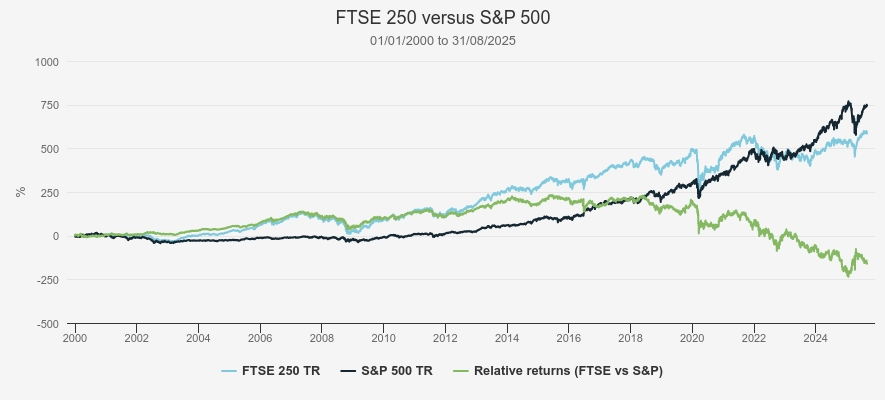
Source: Morningstar. Past performance is not a reliable indicator of future results
FSV’s early performance largely mirrored this dynamic, performing well through periods of UK mid-cap strength, albeit with some downturns, until late 2019. Like many others in the sector, the trust took a hit during the Covid-19 shock, when global markets plunged amid heightened uncertainty. Since then, its contrarian, value-oriented philosophy, which has been maintained through manager changes, buying out-of-favour, cyclical, or undervalued businesses when sentiment is weakest, has really kicked in. Against a backdrop of rising rates and inflation, FSV has performed particularly well, with a notable portion of its gains coming in the last five years, almost double that of its primary index, the FTSE All-Share.
This strong performance reflects both favourable market conditions and disciplined management. A steady bias towards small- and mid-cap opportunities, combined with selective stock picking, has provided exposure to higher growth and takeover activity, whilst judicious use of modest gearing amplified gains during upswings. The managers have also been adept at identifying special situations, turnarounds, corporate restructurings, and takeover candidates, alongside more resilient dividend growers that provide ballast.
Of course, this contrarian approach has brought prolonged periods of underperformance, particularly when investors favoured US equities for growth or looked further east for diversification. But over the past quarter century, those willing to back unpopular companies ha during the global financial crisis — have ultimately benefitted from FSV’s long-term compounding.
Rounding out the remainder of the top ten, this diverse group of trusts highlights the breadth of sectors delivering strong long-term returns. Worldwide Healthcare has capitalised on structural growth in biotechnology and healthcare, benefiting from innovation and demographic trends, while Pacific Horizon has captured opportunities across the Asia-Pacific region, particularly in AI and semiconductor growth. Scottish Mortgage performed exceptionally in the run-up to the height of Covid but has experienced sharp drawdowns amid rising rates and inflation, reflecting the volatility inherent in its growth-focused, concentrated approach to disruptive companies.
Fidelity European Trust has delivered strong, consistent performance and will consolidate its position with Henderson European Trust, becoming the largest European equity investment trust with a market cap exceeding £2 billion. BlackRock World Mining taps into the cyclical but high-reward commodities and natural resources sector, offering a higher-risk profile that has delivered meaningful gains during commodity upswings. Across this group, annualised returns, drawdowns, and standard deviations vary considerably, underscoring that strong long-term performance can be achieved through a range of strategies and asset classes.
Patience through pain points
When looking at investment trusts, it’s crucial to distinguish NAV and share price performance. The NAV measures the value of the trust’s assets, and it’s the yardstick for judging how well a manager is compounding value over time. By contrast, the share price reflects what investors are willing to pay. That sentiment is captured in the discount or premium and the shareholder experience depends on both. In the short term, the difference can be dramatic, but we would expect it to largely wash out over the long run.
However, our data shows some pretty significant differences between share price and NAV performance over our 25 year period. The largest difference is for HGT, worth six times your original investment, with the lowest being for FEV, which is just one time the original investment.
SHARE PRICE AND NAV COMPARISON
| Trust | Sector | 25yr SP TR (cumulative) % | 25yr NAV TR (cumulative) % | Difference between SP and NAV |
| HgCapital Trust | Private Equity | 3,255.10 | 2,649.60 | 605.5 |
| abrdn Asia Focus | Asia Pacific Smaller Companies | 2,779.80 | 2,514.00 | 265.8 |
| Scottish Oriental Smaller Companies | Asia Pacific Smaller Companies | 2,474.80 | 2,034.60 | 440.2 |
| 3i Group | Private Equity | 2,435.80 | 1,900.40 | 535.4 |
| Fidelity Special Values | UK All Companies | 1,642.40 | 1,462.40 | 180 |
| Worldwide Healthcare | Biotechnology & Healthcare | 1,637.00 | 1,333.40 | 303.5 |
| Pacific Horizon | Asia Pacific | 1,624.00 | 1,393.10 | 230.9 |
| Scottish Mortgage | Global | 1,528.60 | 1,312.20 | 216.4 |
| Fidelity European Trust | Europe | 1,277.90 | 1,173.50 | 104.4 |
| BlackRock World Mining Trust | Commodities & Natural Resources | 1,265.90 | 1,074.30 | 191.7 |
Source: Morningstar. Past performance is not a reliable indicator of future results.
The reason for this seems to be, based on the data that we can dig out after such a long time, that the sector was on generally wide discounts during the period that kicked off our 25 year timespan, and those with the largest difference between NAV and share price gains were on some of the widest discounts, such as HGT. As we noted above, it still delivered the highest NAV growth over the period, despite the kicker to the share price. In fact, it is notable there is almost no difference in the order of these trusts on a share price or NAV basis. The top 10 in the whole universe on NAV are almost identical, with only BRWM slipping a handful of places down the list at the expense of Canadian General Investments Ord GBP (LSE:CGI).
Conclusion
Over the past 25 years, patient compounding of NAV, resilience through setbacks, and the ability to let time do the heavy lifting has delivered exceptional returns, whilst discounts closing have added another kicker. It’s interesting to note how strong returns have been over a period in which we have seen the dotcom crash, the GFC, the pandemic and endless other short-term panics. For those with a long-term time horizon we think this is a reason to be optimistic and be brave with investments.
Kepler Partners is a third-party supplier and not part of interactive investor. Neither Kepler Partners or interactive investor will be responsible for any losses that may be incurred as a result of a trading idea.
These articles are provided for information purposes only. Occasionally, an opinion about whether to buy or sell a specific investment may be provided by third parties. The content is not intended to be a personal recommendation to buy or sell any financial instrument or product, or to adopt any investment strategy as it is not provided based on an assessment of your investing knowledge and experience, your financial situation or your investment objectives. The value of your investments, and the income derived from them, may go down as well as up. You may not get back all the money that you invest. The investments referred to in this article may not be suitable for all investors, and if in doubt, an investor should seek advice from a qualified investment adviser.
Full performance can be found on the company or index summary page on the interactive investor website. Simply click on the company's or index name highlighted in the article.
Important Information
Kepler Partners is not authorised to make recommendations to Retail Clients. This report is based on factual information only, and is solely for information purposes only and any views contained in it must not be construed as investment or tax advice or a recommendation to buy, sell or take any action in relation to any investment.
This report has been issued by Kepler Partners LLP solely for information purposes only and the views contained in it must not be construed as investment or tax advice or a recommendation to buy, sell or take any action in relation to any investment. If you are unclear about any of the information on this website or its suitability for you, please contact your financial or tax adviser, or an independent financial or tax adviser before making any investment or financial decisions.
The information provided on this website is not intended for distribution to, or use by, any person or entity in any jurisdiction or country where such distribution or use would be contrary to law or regulation or which would subject Kepler Partners LLP to any registration requirement within such jurisdiction or country. Persons who access this information are required to inform themselves and to comply with any such restrictions. In particular, this website is exclusively for non-US Persons. The information in this website is not for distribution to and does not constitute an offer to sell or the solicitation of any offer to buy any securities in the United States of America to or for the benefit of US Persons.
This is a marketing document, should be considered non-independent research and is subject to the rules in COBS 12.3 relating to such research. It has not been prepared in accordance with legal requirements designed to promote the independence of investment research.
No representation or warranty, express or implied, is given by any person as to the accuracy or completeness of the information and no responsibility or liability is accepted for the accuracy or sufficiency of any of the information, for any errors, omissions or misstatements, negligent or otherwise. Any views and opinions, whilst given in good faith, are subject to change without notice.
This is not an official confirmation of terms and is not to be taken as advice to take any action in relation to any investment mentioned herein. Any prices or quotations contained herein are indicative only.
Kepler Partners LLP (including its partners, employees and representatives) or a connected person may have positions in or options on the securities detailed in this report, and may buy, sell or offer to purchase or sell such securities from time to time, but will at all times be subject to restrictions imposed by the firm's internal rules. A copy of the firm's conflict of interest policy is available on request.
Past performance is not necessarily a guide to the future. The value of investments can fall as well as rise and you may get back less than you invested when you decide to sell your investments. It is strongly recommended that Independent financial advice should be taken before entering into any financial transaction.
PLEASE SEE ALSO OUR TERMS AND CONDITIONS
Kepler Partners LLP is a limited liability partnership registered in England and Wales at 9/10 Savile Row, London W1S 3PF with registered number OC334771.
Kepler Partners LLP is authorised and regulated by the Financial Conduct Authority.