Amerisur Resources in chart breakout to 11-week high
10th December 2018 13:42
by Rajan Dhall from interactive investor
After another good day at the office for Amerisur, financial markets analyst Rajan Dhall has a look at the data and the charts to assess implications for the share price.

Oil markets have been trading mixed since hitting a high of $54.20 per barrel (spot WTI) on Friday following the announcement of an OPEC+ cut of 1.2 million barrels per day (mbpd).
Problem with OPEC has been the rumour. The markets had previously heard reports that the oil cartel would agree "at least" a cut of 1.3 mbpd, so the fact has been disappointing, which explains why WTI is now consolidating at around $51.73 per barrel.
It has been said that Russia has agreed to cut at least 200,000 barrels per day, but this has not been confirmed and some reports have suggested it could be up to 324,000. What is clear is that the OPEC members themselves will cut 800,0000 and the rest will come from outside OPEC (Russian included). The deal is said to last six months and start from January 2019.
Price action in WTI has been choppy, and we have now developed a base on the daily chart between $49.44 and $54.54 per barrel. A breakout to the upside is likely if we see further drawdowns in inventory levels like last week's Department of Energy (DoE) data, which printed a draw of 7.323 million. Keep an eye out for API's tomorrow evening and DoE's on Wednesday afternoon.
Amerisur Resources
Amerisur Resources, the oil and gas producer focused on South America, has confirmed rumours of an oil find in Colombia.
The share price traded as high as 14.4p, up 22% on the previous closing price, after the firm said drilling at its Indico-1 well on the CPO-5 block (Amerisur 30%) has reached target depth of 10,604 feet measured depth, and has encountered the targeted lower sands (LS3) of the Une formation.
This is the same formation which holds the 120 feet oil column discovered at Mariposa, around 6.5 kilometres to the North West of Indico-1. The Mariposa well has produced at a stable rate of about 3,200 barrels of oil per day for over a year, producing over 1.2 million barrels of oil.
Early analysis indicates a 283-feet gross, 209 -feet net, oil column is present in the LS3 formation of high quality sand. No Oil-Water-Contact (OWC) was detected in the wireline logs acquired to date.
The next steps for the well operations include the acquisition of further wireline logging data, including pressures and samples across the reservoir. A 7-inch production liner will then be run and cemented followed by short term testing of the well.
Amerisur chief executive John Wardle is a happy chap. ''The results of the drilling have significantly exceeded our expectations'.
"Naturally, given this result, the company and our partner will be reviewing options for further appraisal wells into the Indico structure in the short term, which will be required to further extend and define the resources encountered."
Amerisur Resources chart analysis
Looking at the weekly chart, you can see there has been a pick-up in volume and a break of the longer term trendline.
The on-balance volume (OBV) indicator* at the bottom of the chart is suggesting that the recent move higher has been back by some buyers, but nearer term 14p provided some resistance.
A stronger level just above that is 15p where the share price bounced quite hard as support around late October 2017. It is now a major level where both buyers and sellers find fair value as many contracts have been traded there, demonstrated by the volume profile indicator on the left-hand side of the chart.
Never-the-less, if the bulls manage to take the share price through 15p, it could be an interesting level of support longer term as a higher low would need to be created to form a change in trend.
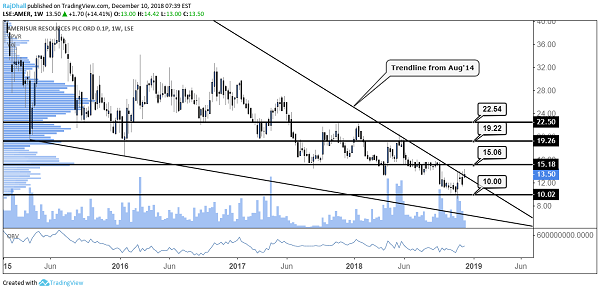
* the OBV measures the share price move against the number of contracts traded, the indicator would be near the top if a move higher was supported by significant buying.
*Horizontal lines on charts represent levels of previous technical support and resistance.
These articles are provided for information purposes only. Occasionally, an opinion about whether to buy or sell a specific investment may be provided by third parties. The content is not intended to be a personal recommendation to buy or sell any financial instrument or product, or to adopt any investment strategy as it is not provided based on an assessment of your investing knowledge and experience, your financial situation or your investment objectives. The value of your investments, and the income derived from them, may go down as well as up. You may not get back all the money that you invest. The investments referred to in this article may not be suitable for all investors, and if in doubt, an investor should seek advice from a qualified investment adviser.
Full performance can be found on the company or index summary page on the interactive investor website. Simply click on the company's or index name highlighted in the article.