Are RBS shares about to bounce anytime now?
Bank shares have struggled recently, so our chartist assesses the odds of a recovery.
23rd January 2020 08:55
by Alistair Strang from Trends and Targets
Bank shares have struggled recently, so our chartist assesses the odds of a recovery.
Royal Bank of Scotland
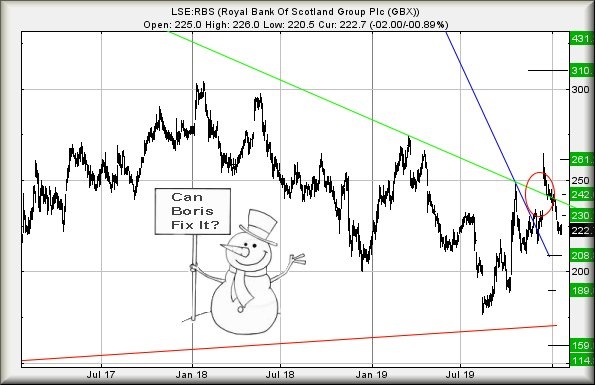
It's time for our monthly dip into the rancid waters of the UK's Retail Banking Sector. So far this year, Royal Bank of Scotland (LSE:RBS) hasn't needed to seek trouble as the price revels in a period of decline.
We're not even confident a downtrend exists to map movements against, the price tending to move with the directional qualities of a house fly!
At time of writing, it's trading around 222p and we've a 'concern' level flagged at 211.25p.
Essentially, if the price next manages to trade below such a level, an initial (useless) drop target of 208p is expected.
In fairness, we'd expect some sort of bounce at the 208p level, despite any initial break.
Our secondary target, and hopefully a sensible bottom, calculates down at 189p. (or 18.9p in old money, prior to their 10:1 reconfiguration in an attempt to hide quite how dire price movements have been)
There's a pretty major problem, should 189p break.
As the chart shows, 159p lurks below this level but as the price moves into the land of lower lows, bottom works out at 114p eventually.
There is (thankfully) a fairly major 'however'.
Circled on the chart was a forced movement to propel RBS above a trend line. At the time, we feared the share could suffer being gapped back below the trend, a market ploy which traditionally leaves investors walking funny.
Thankfully, this has not happened (so far) either with RBS, Barclays (LSE:BARC) or Lloyds Banking Group (LSE:LLOY). This gives us vague hope the market isn't intending to utterly throttle retail bank share prices.
If this is to prove the case, we'd hope for a bounce anytime now.
In theory, anything above 226p calculates with an initial potential of 230p, utterly useless in the great scheme of things.
But if 230p is exceeded, we're looking for secondary at 242p along with recovery above the trend.
This should be significant, moving the share to relative safety with at least an attempt at the level of the most recent high, our target calculating at 261p.
Source: Trends and Targets Past performance is not a guide to future performance
Alistair Strang has led high-profile and "top secret" software projects since the late 1970s and won the original John Logie Baird Award for inventors and innovators. After the financial crash, he wanted to know "how it worked" with a view to mimicking existing trading formulas and predicting what was coming next. His results speak for themselves as he continually refines the methodology.
Alistair Strang is a freelance contributor and not a direct employee of Interactive Investor. All correspondence is with Alistair Strang, who for these purposes is deemed a third-party supplier. Buying, selling and investing in shares is not without risk. Market and company movement will affect your performance and you may get back less than you invest. Neither Alistair Strang or Interactive Investor will be responsible for any losses that may be incurred as a result of following a trading idea.
These articles are provided for information purposes only. Occasionally, an opinion about whether to buy or sell a specific investment may be provided by third parties. The content is not intended to be a personal recommendation to buy or sell any financial instrument or product, or to adopt any investment strategy as it is not provided based on an assessment of your investing knowledge and experience, your financial situation or your investment objectives. The value of your investments, and the income derived from them, may go down as well as up. You may not get back all the money that you invest. The investments referred to in this article may not be suitable for all investors, and if in doubt, an investor should seek advice from a qualified investment adviser.
Full performance can be found on the company or index summary page on the interactive investor website. Simply click on the company's or index name highlighted in the article.