Barclays shares must do this to begin a proper recovery
Still nursing wounds a decade after the Financial Crisis, here's what our chartist thinks of Barclays.
27th June 2019 08:53
by Alistair Strang from Trends and Targets
Still nursing wounds a decade after the Financial Crisis, here's what our chartist thinks of Barclays.
Barclays PLC (LSE:BARC)
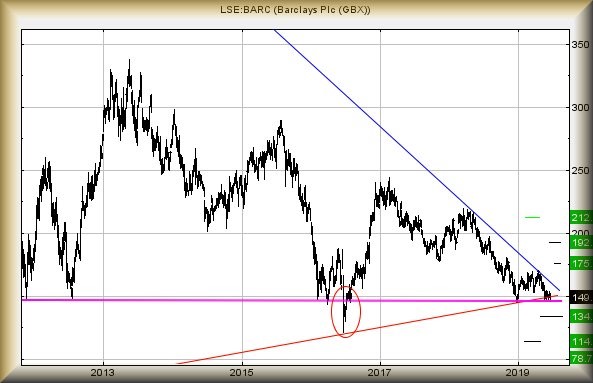
Sometimes we rabbit on about "horizontal trends" and nowhere is the feature quite as demonstrated as Barclays (LSE:BARC) share price since 2011. We've shown it with a purple line on the chart, though perhaps it may be Magenta.
Spoiling the story, the colour conflict had nothing to do with The Battle of Magenta, especially as the dye was discovered in 1859 and named in honour of the event. It is interesting to note the leader of French forces was actually of Irish descent, his family driven out of Ireland due to English property confiscations, opting to settle in France. Patrice de MacMahon (Paddy to his mates) eventually became President of France!
Aside from a whimsical wander through history, along with an ongoing in-house debate regarding Purple or Magenta, we should really discuss what's happening (or rather not happening) with Barclays share price.
Last time we reviewed it, we waxed lyrical about the dangers of 148.823p, if the share had the temerity to close below this level.
Such a disaster has happened three times in the last week, salt being rubbed on the wound by the price also trading below 147p (apparently the final drop trigger) for a few hours.
Yet, the price has not plunged into the abyss of doom, instead appearing to find some sort of excuse for a bounce.
Alas, this is where the purple (or magenta) line comes into play, a horizontal trend dating back eight years and one we'd ignored, due to Barclays share price habit of dipping below this 147p line, only to recovery sharply thereafter.
Only in 2016 - following the Brexit vote (circled) - did the price conclusively dip below this line but once again, sharply recovered. It's important to accept therefore this trend can be broken.
The situation now, from a big picture perspective, is of weakness below 146p now entering a cycle down to an initial 134p. Secondary, when broken, is a bottom, hopefully, of 114p.
To a degree, it feels we are clutching at straws, perplexed Barclays has avoided the opportunity to drive off a cliff. The answer to our confusion doubtless lies with politics and political uncertainty as we await white smoke coming from 10 Downing St chimney to tell us which bus driver has been anointed to actually steer the nation.
Currently, Barclays share price requires above 162p to suggest it has actually bottomed, in doing so entering a region where a cycle to 175p should commence. If bettered, a longer term 192p is now possible.
If we adhere to our "normal" rules, we must accept 114p looks like the eventual drop target.
Source: Trends and Targets Past performance is not a guide to future performance
Alistair Strang has led high-profile and "top secret" software projects since the late 1970s and won the original John Logie Baird Award for inventors and innovators. After the financial crash, he wanted to know "how it worked" with a view to mimicking existing trading formulas and predicting what was coming next. His results speak for themselves as he continually refines the methodology.
Alistair Strang is a freelance contributor and not a direct employee of Interactive Investor. All correspondence is with Alistair Strang, who for these purposes is deemed a third-party supplier. Buying, selling and investing in shares is not without risk. Market and company movement will affect your performance and you may get back less than you invest. Neither Alistair Strang or Interactive Investor will be responsible for any losses that may be incurred as a result of following a trading idea.
These articles are provided for information purposes only. Occasionally, an opinion about whether to buy or sell a specific investment may be provided by third parties. The content is not intended to be a personal recommendation to buy or sell any financial instrument or product, or to adopt any investment strategy as it is not provided based on an assessment of your investing knowledge and experience, your financial situation or your investment objectives. The value of your investments, and the income derived from them, may go down as well as up. You may not get back all the money that you invest. The investments referred to in this article may not be suitable for all investors, and if in doubt, an investor should seek advice from a qualified investment adviser.
Full performance can be found on the company or index summary page on the interactive investor website. Simply click on the company's or index name highlighted in the article.