The cheapest investment trusts and big yields
7th December 2018 09:12
This content is provided by Kepler Trust Intelligence, an investment trust focused website for private and professional investors. Kepler Trust Intelligence is a third-party supplier and not part of interactive investor. It is provided for information only and does not constitute a personal recommendation.
Material produced by Kepler Trust Intelligence should be considered a marketing communication, and is not independent research.
As rough markets drive share price volatility up, we use a proprietary statistical technique to highlight trusts which are on unusually wide discounts...

Surf's up
William Heathcoat Amory, Co-founding Partner at Kepler Trust Intelligence.
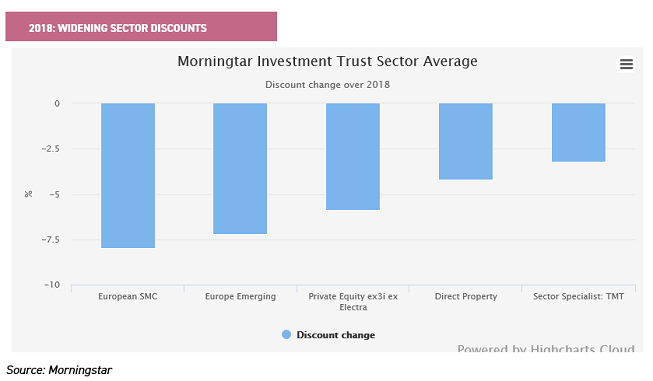
With the current bout of volatility and uncertainty in markets, discounts across the investment trust sector have widened out. The overall picture shows that conventional trust discounts have widened from near 5% level at the start of the year, to the current average discount of 7%.
The average masks much. The European Smaller Companies sector for example has seen the average discount widen from near par to c 9%. Private Equity trusts have also seen plenty of profit taking, and sentiment in the TMT sector is also sagging given the volatility seen in these stocks.
Discounts are one of the most visible ways for investors looking at investment trusts to judge whether or not they are 'cheap'. It seems obvious that buying an asset worth a pound for 85p - the equivalent of a 15% discount in the terminology of the investment trust market - is an attractive opportunity.
As we all know, however, discounts can be persistent and it may be that the price at which an investment trust trades relative to the NAV never narrows. In such a scenario, investors will have fallen for a 'mirage', with a palpable narrowing of the discount never materialising.
On the other hand, it is possible that an investor can materially enhance returns should sentiment towards a trust improve such that the discount does narrow. Indeed, should the discount on an investment trust narrow to zero (perhaps because sentiment improves, there is a change in mandate, or the trust winds-up and returns capital at NAV), the maths dictates that an investor will achieve the trust's NAV return (positive or negative), but with returns boosted as the discount is eliminated.
Theory…
In a bid to identify trusts with the potential for a narrower discount in the future, and reflecting the fact that discounts for trusts tend to trade in bands, analysts have devised Z-scores. A Z-score tells you how many standard deviations away from the mean the trust is trading (in discount terms) on a given day. For example, given the mathematical definition of a normal distribution, roughly 95% of observations occur within two standard deviations of the mean. Therefore a trust trading two standard deviations below the mean is on one of the 2.5% widest discounts in the period in question.
These are typically used to highlight value on a short term basis, and tend to be used by traders more than investors. An example of how difficult it is to capture the 'value' on offer using Z-scores is exemplified by monitoring the BlackRock World Mining discount during the period we have been writing this article. When we first started writing this article, the discount of approaching 16% had a one-year Z-score of -2.2, indicating the trust was very cheap. Move on a week or two, and now the trust has a discount of c. 12% and a Z-score of 0.4. One would have had to acted very fast to benefit – and clearly faster than the board who bought shares back (we estimate) on a discount of around 16%. So whilst Z-scores are helpful, they are difficult to actually benefit from as an ordinary investor. They also don’t reflect longer term cycles in sentiment. Unless an investor is very quick off the mark, the apparent value doesn’t remain on the table very long.
An alternative indicator of value which we first introduced as a methodology nearly two years ago, looks at the average monthly discount of an investment trust going back ten years. By taking average monthly discounts it is possible to take into account broader peaks and troughs in sentiment rather than short term pricing anomalies. We arrange the discounts of each trust in order of magnitude over these ten years, and then work out at what discount level would be in the widest decile (ie the widest 10% of all months in the trusts' histories).
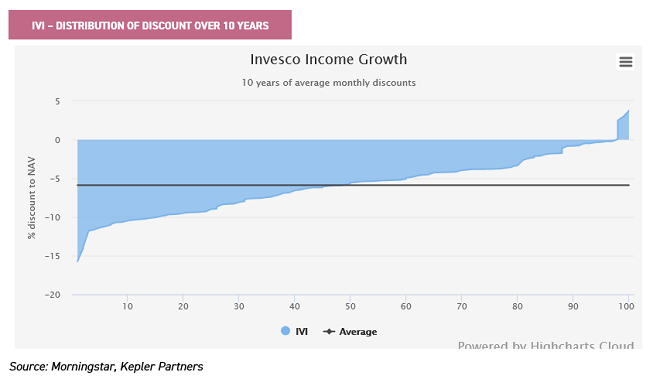
A live example of a trust that our analysis highlights is Invesco Income Growth, which currently trades on a discount of c15%. The discount has been persistent for quite some time, and so it doesn’t stand out particularly with a 1 year z-score of -1.2. Yet according to our analysis it is very close to its widest discount in a decade.
Invesco Income Growth has a cautiously-managed portfolio of UK equities, which aims to produce above inflation dividend growth but also capital growth in excess of the FTSE All Share. Its manager, Ciaran Mallon, to some extent stands in the shade of his better-known colleague Mark Barnett. Yet Ciaran is a bottom-up stock picker with a different approach to management and has an active share in the region of 69%, well above the 60% threshold commonly held out by academics as being the level at which a manager can truly be considered active.
Ciaran's strong emphasis on the sustainability of the dividend and on avoiding taking big macro bets makes this portfolio an interesting proposition for a cautious investor who needs income. Over time, it remains to be seen whether sentiment will turn for the trust, but the graph below shows that the current discount is very much at an extreme level if the record of the past ten years is anything to go by.
Practice
We have run our analysis again, aiming to identify which trusts which are trading at discounts that are very wide relative to their own historical positions. In the graphs below, if the current discount is within percentiles 0%-10% (ie the bottom decile), it will indicate that the trust is trading at its widest discount ever over ten years. Currently across the entire sector, the median average discount is at the 52nd percentile, indicating that trusts are generally trading at a slight premium to their long run average.
In total there are 22 trusts currently that stand out in that 'widest 10% of discounts' as a result of our analysis, out of a total of 188 trusts. As such, according to their own long-term discount histories, these trusts have never been on wider discounts. Several management groups such as Invesco and Aberdeen Standard appear frequently, reflecting the fact that their house investment styles seem to be somewhat out of favour currently.
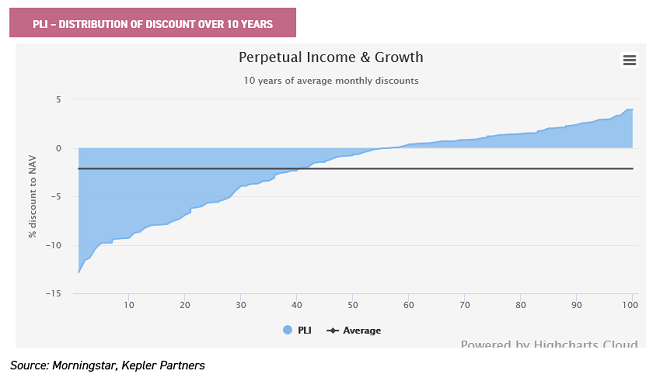
We have already highlighted Invesco Income Growth, but the statistics also highlight Perpetual Income & Growth as notable relative to its discount history. Managed by Mark Barnett in a high-conviction, cautious style with lower beta than the average trust in the AIC UK Equity Income sector, he focuses on large, cash generative companies that in his view are undervalued. The trust has a significant exposure to domestically-focused UK companies which remain deeply unloved. The weak patch of performance has seen the trust slip out to a significant discount of 11.2%, which as the graph below illustrates is firmly in the "left tail" of the distribution of the discount range in the past ten years. PLI's shares yield 4.3% at the time of writing.
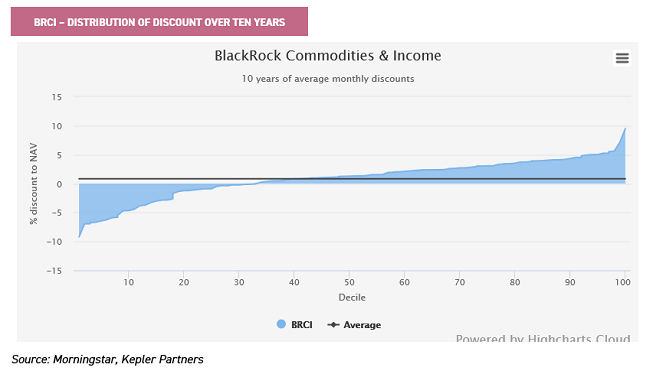
BlackRock Commodities Income currently trades on a discount of 6.2%, and offers a whopping prospective yield of 5.7%. It is managed by Olivia Markham and Tom Holl, typically having an even split between mining and energy stocks. The trust has been negatively affected by trade-war sentiment hitting mining stocks, and more latterly the weak oil price hitting energy stocks. A large chunk of the trust is invested in larger, dividend-paying companies – and with the top ten holdings accounting for c.55% of total assets, the portfolio is fairly concentrated. The 2017 finals and 2018 interims both showed an improvement to overall income earned, enabling the trust to pay a covered dividend once again. With revenue reserves standing at 0.74X current 4p annual dividends, the board has stated that it will look to protect any short-term shortfall in earnings with reserves. At this level, the trust yields considerably more than most other areas of the market. The graph below shows that a discount of 6.8% is relatively wide on a historic basis.
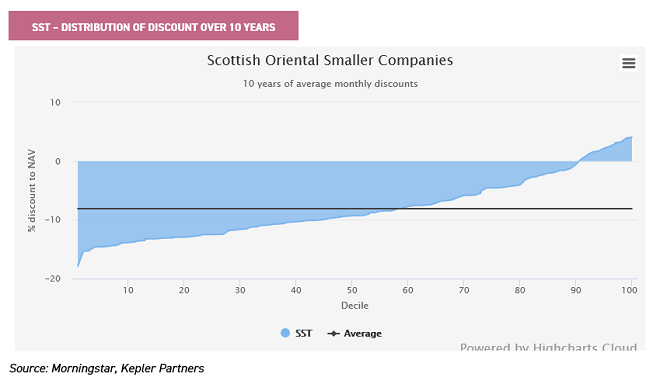
Scottish Oriental Smaller Companies currently trades on a 14.5% discount, which is wide both in absolute and relative terms. As the graph below shows, the trust has been on a persistent discount for quite a while. The managers lagged the recent bull market in emerging market equities, given their preference for quality, and not wanting to pay over the odds. Wary of valuations in their universe, cash levels have drifted up in recent years as the managers became increasingly reluctant to capitulate in a rising market – as at the end of October 18, cash was 6.7% of total assets. The rout in EM equities seen this year has proven their stance correct, and the managers have done a decent job in protecting against the worst relative to peers.
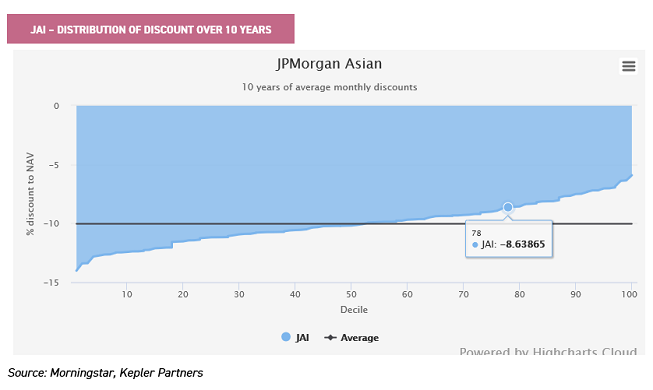
JPMorgan Asian has been on a persistent discount over the past few years. The board has a policy of keeping the discount between 8-10% 'in normal market conditions', but have not employed their buyback policy in the recent EM markets slump, recognising this is far from a 'normal' state of affairs The trust has paid a dividend of 4% of NAV since October 2016, made up of quarterly payments of 1%, the majority of which comes from capital reserves. Other trusts have seen their discounts narrow materially following initiatives such as these. Indeed, initially the discount did narrow to mid single digits in summer 2017. However, since then the discount has widened out and currently trades on a discount of 12%. Performance has been excellent in recent years, with the trust top in a combined open and closed-ended peer group for NAV performance over three years, and having outperformed the index in the bull market of 2017 and the bear market of 2018. The trust is also the cheapest closed-ended option in the space in terms of OCF, and amongst the cheapest in the combined open- and closed-ended sector.
Kepler Partners is a third-party supplier and not part of interactive investor. Neither Kepler Partners or interactive investor will be responsible for any losses that may be incurred as a result of a trading idea.
Full performance can be found on the company or index summary page on the interactive investor website. Simply click on the company's or index name highlighted in the article.
Important Information
Kepler Partners is not authorised to make recommendations to Retail Clients. This report is based on factual information only, and is solely for information purposes only and any views contained in it must not be construed as investment or tax advice or a recommendation to buy, sell or take any action in relation to any investment.
This report has been issued by Kepler Partners LLP solely for information purposes only and the views contained in it must not be construed as investment or tax advice or a recommendation to buy, sell or take any action in relation to any investment. If you are unclear about any of the information on this website or its suitability for you, please contact your financial or tax adviser, or an independent financial or tax adviser before making any investment or financial decisions.
The information provided on this website is not intended for distribution to, or use by, any person or entity in any jurisdiction or country where such distribution or use would be contrary to law or regulation or which would subject Kepler Partners LLP to any registration requirement within such jurisdiction or country. Persons who access this information are required to inform themselves and to comply with any such restrictions. In particular, this website is exclusively for non-US Persons. The information in this website is not for distribution to and does not constitute an offer to sell or the solicitation of any offer to buy any securities in the United States of America to or for the benefit of US Persons.
This is a marketing document, should be considered non-independent research and is subject to the rules in COBS 12.3 relating to such research. It has not been prepared in accordance with legal requirements designed to promote the independence of investment research.
No representation or warranty, express or implied, is given by any person as to the accuracy or completeness of the information and no responsibility or liability is accepted for the accuracy or sufficiency of any of the information, for any errors, omissions or misstatements, negligent or otherwise. Any views and opinions, whilst given in good faith, are subject to change without notice.
This is not an official confirmation of terms and is not to be taken as advice to take any action in relation to any investment mentioned herein. Any prices or quotations contained herein are indicative only.
Kepler Partners LLP (including its partners, employees and representatives) or a connected person may have positions in or options on the securities detailed in this report, and may buy, sell or offer to purchase or sell such securities from time to time, but will at all times be subject to restrictions imposed by the firm's internal rules. A copy of the firm's conflict of interest policy is available on request.
Past performance is not necessarily a guide to the future. The value of investments can fall as well as rise and you may get back less than you invested when you decide to sell your investments. It is strongly recommended that Independent financial advice should be taken before entering into any financial transaction.
PLEASE SEE ALSO OUR TERMS AND CONDITIONS
Kepler Partners LLP is a limited liability partnership registered in England and Wales at 9/10 Savile Row, London W1S 3PF with registered number OC334771.
Kepler Partners LLP is authorised and regulated by the Financial Conduct Authority.
Kepler Partners is a third-party supplier and not part of interactive investor. Neither Kepler Partners or interactive investor will be responsible for any losses that may be incurred as a result of a trading idea.
These articles are provided for information purposes only. Occasionally, an opinion about whether to buy or sell a specific investment may be provided by third parties. The content is not intended to be a personal recommendation to buy or sell any financial instrument or product, or to adopt any investment strategy as it is not provided based on an assessment of your investing knowledge and experience, your financial situation or your investment objectives. The value of your investments, and the income derived from them, may go down as well as up. You may not get back all the money that you invest. The investments referred to in this article may not be suitable for all investors, and if in doubt, an investor should seek advice from a qualified investment adviser.
Full performance can be found on the company or index summary page on the interactive investor website. Simply click on the company's or index name highlighted in the article.
Important Information
Kepler Partners is not authorised to make recommendations to Retail Clients. This report is based on factual information only, and is solely for information purposes only and any views contained in it must not be construed as investment or tax advice or a recommendation to buy, sell or take any action in relation to any investment.
This report has been issued by Kepler Partners LLP solely for information purposes only and the views contained in it must not be construed as investment or tax advice or a recommendation to buy, sell or take any action in relation to any investment. If you are unclear about any of the information on this website or its suitability for you, please contact your financial or tax adviser, or an independent financial or tax adviser before making any investment or financial decisions.
The information provided on this website is not intended for distribution to, or use by, any person or entity in any jurisdiction or country where such distribution or use would be contrary to law or regulation or which would subject Kepler Partners LLP to any registration requirement within such jurisdiction or country. Persons who access this information are required to inform themselves and to comply with any such restrictions. In particular, this website is exclusively for non-US Persons. The information in this website is not for distribution to and does not constitute an offer to sell or the solicitation of any offer to buy any securities in the United States of America to or for the benefit of US Persons.
This is a marketing document, should be considered non-independent research and is subject to the rules in COBS 12.3 relating to such research. It has not been prepared in accordance with legal requirements designed to promote the independence of investment research.
No representation or warranty, express or implied, is given by any person as to the accuracy or completeness of the information and no responsibility or liability is accepted for the accuracy or sufficiency of any of the information, for any errors, omissions or misstatements, negligent or otherwise. Any views and opinions, whilst given in good faith, are subject to change without notice.
This is not an official confirmation of terms and is not to be taken as advice to take any action in relation to any investment mentioned herein. Any prices or quotations contained herein are indicative only.
Kepler Partners LLP (including its partners, employees and representatives) or a connected person may have positions in or options on the securities detailed in this report, and may buy, sell or offer to purchase or sell such securities from time to time, but will at all times be subject to restrictions imposed by the firm's internal rules. A copy of the firm's conflict of interest policy is available on request.
Past performance is not necessarily a guide to the future. The value of investments can fall as well as rise and you may get back less than you invested when you decide to sell your investments. It is strongly recommended that Independent financial advice should be taken before entering into any financial transaction.
PLEASE SEE ALSO OUR TERMS AND CONDITIONS
Kepler Partners LLP is a limited liability partnership registered in England and Wales at 9/10 Savile Row, London W1S 3PF with registered number OC334771.
Kepler Partners LLP is authorised and regulated by the Financial Conduct Authority.
These articles are provided for information purposes only. Occasionally, an opinion about whether to buy or sell a specific investment may be provided by third parties. The content is not intended to be a personal recommendation to buy or sell any financial instrument or product, or to adopt any investment strategy as it is not provided based on an assessment of your investing knowledge and experience, your financial situation or your investment objectives. The value of your investments, and the income derived from them, may go down as well as up. You may not get back all the money that you invest. The investments referred to in this article may not be suitable for all investors, and if in doubt, an investor should seek advice from a qualified investment adviser.
Full performance can be found on the company or index summary page on the interactive investor website. Simply click on the company's or index name highlighted in the article.