Commodities outlook: Will the gold rush last?
With gold now above $1,500 an ounce, our commodities expert considers the outlook for the precious metal.
8th August 2019 13:09
by Rajan Dhall from interactive investor
With gold now above $1,500 an ounce, our commodities expert considers the outlook for the precious metal.

There is only one place to start in commodities markets and that is with gold!
The precious metal hit $1,500 per ounce on Wednesday as central banks around the world start to loosen monetary policy by cutting interest rates and adding stimulus. The RBNZ was the latest central bank to add to that pile as it cut by 50bps when only 25bps was forecast by markets through futures.
What does this all mean for gold?
The bond markets seem to be pricing in a recession in the US and gold is the safe haven of choice for many investors. There are many worrying macroeconomic themes at present with the likes of trade wars, Brexit and Iranian tensions all at the forefront of investors' minds.
Nevertheless, the main turning point for the yellow metal was the Fed only cutting rates by 25bps and ending the balance sheet run-off two months early. Some analysts had expected the Fed to be more accommodative and were sorely disappointed.
President Trump has also cranked up the pressure on the Fed saying "it would be much easier if the Fed understood, which they don’t, that we are competing against other countries, all of whom want to do well at our expense! Three more Central Banks cut rates.”
We will have to wait until the Fed's next meeting in September to see the outcome of this pressure. Some have said the Fed has no choice but to act, although their independence will be under question if they do.
Below is the gold futures weekly chart. The technicals are working a treat although it is nothing fancy. The resistance zone at $1,500 per ounce was an obvious one to spot but now the hard work begins for the gold bulls.
If they are to take it back into the next consolidation zone there has to be a good reason. We will hear from plenty of Fed members between now and the September meeting so if the market starts to price in more aggressive cuts we could get the catalyst. For now, the base case scenario could be a small mean reversion until more data becomes available.
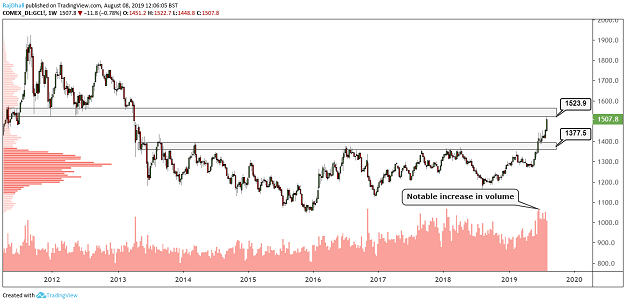
Source: TradingView Past performance is not a guide to future performance
On the oil front, things have taken a turn for the worse in terms of price. Iran has been quiet in recent days and it has been left to Saudi Arabia to prop up prices by looking to keep its production levels below 10 million barrels per day.
After the longer-term trendline on the chart broke to the downside the target was the support level at $50.74 per barrel which held but the latest Department of Energy and American Petroleum Institute inventory figures put pressure on oil as they both came in bigger than expected.
Yesterday's DoE figure even produced a build when a small draw was projected. Looking ahead, the $50 per barrel level is the key one to watch as both Saudi Arabia and Russia have noted a drop below in the past with some action to jawbone the price.
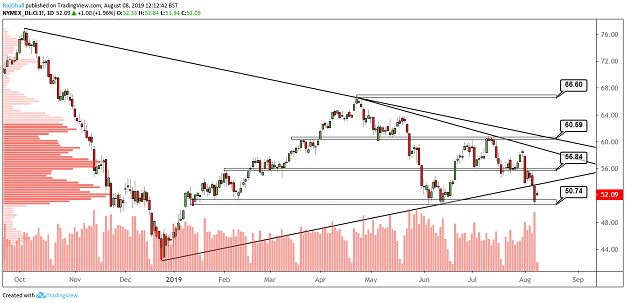
Source: TradingView Past performance is not a guide to future performance
Rajan Dhall is a freelance contributor and not a direct employee of interactive investor.
These articles are provided for information purposes only. Occasionally, an opinion about whether to buy or sell a specific investment may be provided by third parties. The content is not intended to be a personal recommendation to buy or sell any financial instrument or product, or to adopt any investment strategy as it is not provided based on an assessment of your investing knowledge and experience, your financial situation or your investment objectives. The value of your investments, and the income derived from them, may go down as well as up. You may not get back all the money that you invest. The investments referred to in this article may not be suitable for all investors, and if in doubt, an investor should seek advice from a qualified investment adviser.
Full performance can be found on the company or index summary page on the interactive investor website. Simply click on the company's or index name highlighted in the article.