FTSE 100: Here's why this analyst is feeling optimistic
It's that time of the year where the index shows its usual bounce. Our chartist examines if it's genuine.
24th January 2020 08:52
by Alistair Strang from Trends and Targets
It's that time of the year where the index shows its usual bounce. Our chartist examines if it's genuine.

FTSE for Friday (FTSE:UKX)
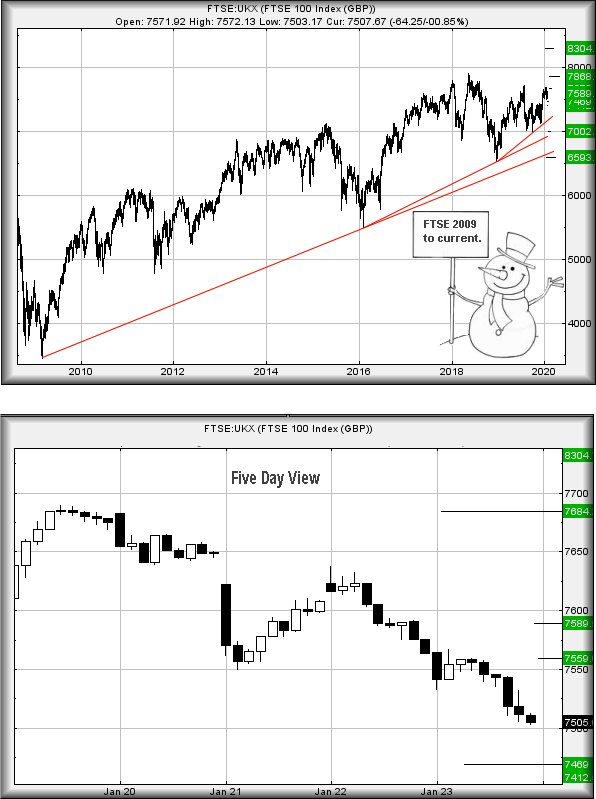
As Davos snowploughs to an end, shall we see the FTSE 100 exhibit its 'usual' January bounce, or are we about to experience a giant slalom, through a mogul field, populated by people on snowboards? Please remember we are analysing the FTSE, not After Hours Futures.
Presently trading around the 7,500 level [as at close of play Thursday 23rd January], the FTSE needs below 7,356 to inspire serious alarm.
Movement such as this risks taking the market into territory where weakness to an initial 7,000 points becomes possible. Secondary calculates at 6,593 points.
Thankfully, the visuals associated with such a trigger event seem fairly unlikely (except for the glass floor at the 7,000 level), this making us suspect market reversal is not on the immediate cards.
Obviously, 'stuff' happens which cannot be factored in but, for the present, there's a lack of force pointing downward. This week, while fairly grotty, has not yet triggered anything scary.
Near term, below 7,503 looks capable of provoking reversal down to 7,469 points.
If broken, secondary calculates at 7,412 points. Neither reversal point comes close to challenging the uptrend since 2018.
The other side of the coin, a rather more optimistic outlook, looks at what we should expect if (when) the index exceeds 7,690 points?
Initially, we're looking for travel up to an initial 7,868 points with secondary, when bettered, up at 8,304 points.
Near term, above 7,530 points calculates with an initial ambition at 7,559 points.
If exceeded, our secondary comes in at 7,589 points and gives quite a lot of hope for continued market recovery next week.
Curiously, there's a glass ceiling awaiting at 7,630, a point where some hesitation is possible. But as the index will be trading in a zone with a third target level of 7,684 - virtually at the trigger level for long term movement, we're presently inclined toward optimism.
Source: Trends and Targets Past performance is not a guide to future performance
Alistair Strang has led high-profile and "top secret" software projects since the late 1970s and won the original John Logie Baird Award for inventors and innovators. After the financial crash, he wanted to know "how it worked" with a view to mimicking existing trading formulas and predicting what was coming next. His results speak for themselves as he continually refines the methodology.
Alistair Strang is a freelance contributor and not a direct employee of Interactive Investor. All correspondence is with Alistair Strang, who for these purposes is deemed a third-party supplier. Buying, selling and investing in shares is not without risk. Market and company movement will affect your performance and you may get back less than you invest. Neither Alistair Strang or Interactive Investor will be responsible for any losses that may be incurred as a result of following a trading idea.
These articles are provided for information purposes only. Occasionally, an opinion about whether to buy or sell a specific investment may be provided by third parties. The content is not intended to be a personal recommendation to buy or sell any financial instrument or product, or to adopt any investment strategy as it is not provided based on an assessment of your investing knowledge and experience, your financial situation or your investment objectives. The value of your investments, and the income derived from them, may go down as well as up. You may not get back all the money that you invest. The investments referred to in this article may not be suitable for all investors, and if in doubt, an investor should seek advice from a qualified investment adviser.
Full performance can be found on the company or index summary page on the interactive investor website. Simply click on the company's or index name highlighted in the article.