FTSE 100: Making sense of a static market
The FTSE is hoping for the best while prepping for the worst. Our chartist looks at key trading levels.
8th March 2019 08:39
by Alistair Strang from Trends and Targets
The FTSE is hoping for the best while prepping for the worst. Our chartist looks at key trading levels.

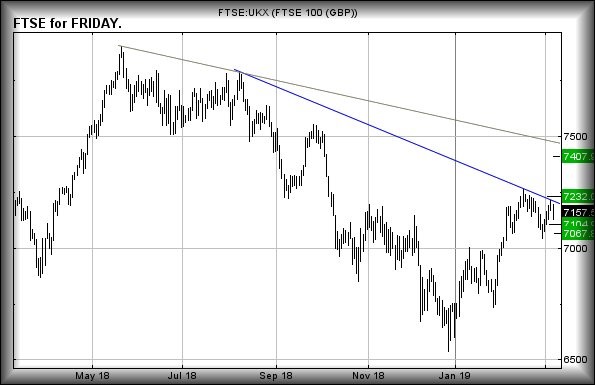
FTSE for Friday (FTSE:UKX)
Despite concentrating on the all important countdown to the new Formula 1 season (9 days), a few things concern us about the FTSE 100 index.
Firstly, the financial volumes going through London at present are around half what we'd expect at this time of year. Secondly, and doubtless related, the market isn't really moving!
Since the start of February, the FTSE has exhibited a useless 250-point trading range. This is very effectively trapping share prices in a twilight zone, where, despite major triggers being hit, nothing effectively happens.
It's fairly obvious the current poisonous Brexit climate is fouling things up completely, and the UK market is obliging, hoping for the best while prepping for the worst.
At present, the FTSE eloquently reflects this hiatus. It has triggered a movement to 7,400 points. This is something which we'd normally be pretty confident about but, instead, the market has opted to create a near-term downtrend which is proving difficult to beat.
At present, the suggestion is of near-term growth above 7,210 triggering an onslaught of 7,232 points. Obviously, pretty useless, but above 7,232 is supposed to indicate a cycle commencing to the 7,400 level.
We rather suspect, even if the immediate 'blue' downtrend on the chart below is bettered, our best hope would be for the market to invent a new glass ceiling at the 7,232 level.
Of course, there's a reasonable chance the index will eschew any attempt to 'blue'. In the case of weakness now below 7,125 points, we'd expect coming reversal to 7,104 points initially.
If broken, secondary is down at 7,067 points and a probable bounce. If triggered, the tightest stop is unpleasantly wide at 7,196 points.
Source: Trends and Targets Past performance is not a guide to future performance
Alistair Strang has led high-profile and "top secret" software projects since the late 1970s and won the original John Logie Baird Award for inventors and innovators. After the financial crash, he wanted to know "how it worked" with a view to mimicking existing trading formulas and predicting what was coming next. His results speak for themselves as he continually refines the methodology.
Alistair Strang is a freelance contributor and not a direct employee of Interactive Investor. All correspondence is with Alistair Strang, who for these purposes is deemed a third-party supplier. Buying, selling and investing in shares is not without risk. Market and company movement will affect your performance and you may get back less than you invest. Neither Alistair Strang or Interactive Investor will be responsible for any losses that may be incurred as a result of following a trading idea.
These articles are provided for information purposes only. Occasionally, an opinion about whether to buy or sell a specific investment may be provided by third parties. The content is not intended to be a personal recommendation to buy or sell any financial instrument or product, or to adopt any investment strategy as it is not provided based on an assessment of your investing knowledge and experience, your financial situation or your investment objectives. The value of your investments, and the income derived from them, may go down as well as up. You may not get back all the money that you invest. The investments referred to in this article may not be suitable for all investors, and if in doubt, an investor should seek advice from a qualified investment adviser.
Full performance can be found on the company or index summary page on the interactive investor website. Simply click on the company's or index name highlighted in the article.