FTSE 100 must do this to avoid a significant fall
11th January 2019 08:34
by Alistair Strang from Trends and Targets
As we race toward Brexit, and with things still no clearer, chartist Alistair Strang and his software attempt to give clarity on where the blue-chip index might be heading.
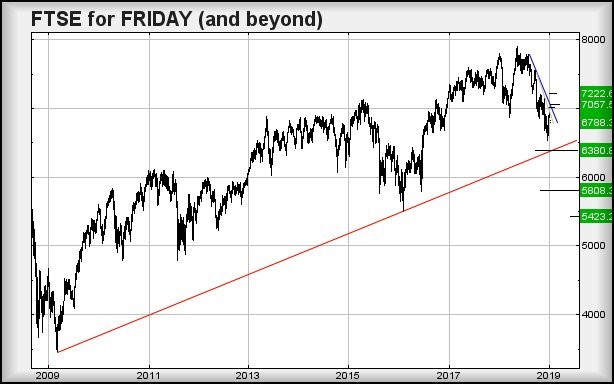
FTSE for FRIDAY (FTSE:UKX)
At present, the FTSE 100 index requires to close a session above 7,052 points to trash our miserable outlook which anticipates a bottom in the 5,800's.
What amuses was our success last Friday, giving near-term forecast scenario in each direction. Despite our belief that the market faced a grotty day, it was our upward scenario which triggered, achieving targets.
The chart below is from 2009 and, at present, the red uptrend is at 6,405 points. Basically put, if the market closes a session below this level, it ticks a final box, burns a final bridge, and breaks the last straw in its journey to the 5,800 level.
Perhaps there will be a fake bounce around 6,380 but we have our doubts. Essentially, if the FTSE were a share, we would expect it to drop eventually.
From a near-term perspective, things are getting interesting as evinced in a European Central Bank press release:
"ECB : Risks are rotating in uncertain environment"
Translation: "We have no idea what's happening"
In the case of the FTSE 100, we're full of doom and gloom whereas the index itself has been showing some surprising positive motions, leaving us uncomfortable with our certainty for a drop! And also echoing the ECB's thoughts!
Near-term, above 6,950 is supposed to generate travel to an initial 7,006 points. If exceeded, secondary is at 7,057 where some sort of hesitation can be expected. Visually, this secondary is essentially matching the immediate blue downtrend. And only with closure above 7,052 points will we be forced to abandon our favoured gloomy outlook!
The opposing scenario, near-term, indicates weakness below 6,860 should provoke reversal to an initial 6,825 points. If broken, secondary calculates at 6,788 points. If triggered, stop needs be quite wide at 6,920 points.
Have a good weekend.
Source: Trends and Targets. Past performance is not a reliable indicator of future results
These articles are provided for information purposes only. Occasionally, an opinion about whether to buy or sell a specific investment may be provided by third parties. The content is not intended to be a personal recommendation to buy or sell any financial instrument or product, or to adopt any investment strategy as it is not provided based on an assessment of your investing knowledge and experience, your financial situation or your investment objectives. The value of your investments, and the income derived from them, may go down as well as up. You may not get back all the money that you invest. The investments referred to in this article may not be suitable for all investors, and if in doubt, an investor should seek advice from a qualified investment adviser.
Full performance can be found on the company or index summary page on the interactive investor website. Simply click on the company's or index name highlighted in the article.