Is FTSE 100 nearing a ceiling?
28th September 2018 08:33
by Alistair Strang from Trends and Targets
The blue-chip index has rallied due to the pound's decline, but how much further can this recovery go? Chartist Alistair Strang examines the key scenarios.

FTSE for Friday (FTSE:UKX)
Hopefully our report for Friday does give information which proves as useful as last Friday's!
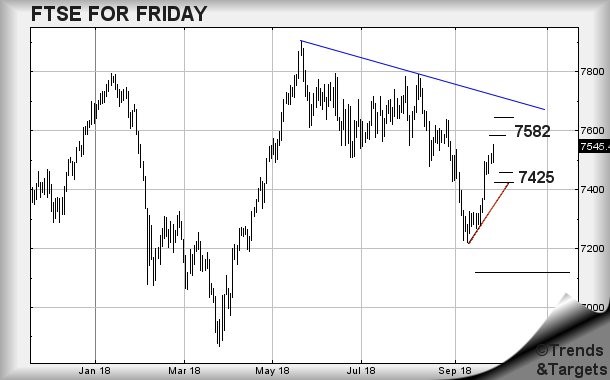
There's certainly quite a lot to like about the UK market as near-term movement above 7,553 points indicates the potential of 7,582 making an appearance. If bettered, we can mention 7,644 calculates as secondary.
If triggered, the index needs fall below 7,452 to trash the prospects and this, somewhat neatly, balances the risk/reward ratio. With the potential of a 100 point rise, it makes horrible sense for a near 100 point stop loss point.
We'd regard any weakness now below 7,473 points as fairly risky. It calculates as bring a drop potential to an initial 7,458 points as possible. If broken, secondary is at 7,425 points. If triggered, the tightest stop is at 7,520 points.
As a few folks have commented, we've abandoned our Sunday evening "FTSE for the coming week" as it essentially was a bit boring, writing about the index for Friday, then attempting a new form of words just a few days later. We're now opting to skip around World Indices & Commodities but there is something we really need to regurgitate from a FTSE Big Picture aspect.
Across the top of the chart is a blue line. At present, it's at 7,717 points. Only once the FTSE actually trades above such a level dare we completely rubbish the prospect of 7,120 making a guest appearance as bottom on the market. For now, it feels like the index wants to go up but we fear a ceiling is approaching.
Source: Trends and Targets Past performance is not a guide to future performance
Alistair Strang has led high-profile and "top secret" software projects since the late 1970s and won the original John Logie Baird Award for inventors and innovators. After the financial crash, he wanted to know "how it worked" with a view to mimicking existing trading formulas and predicting what was coming next. His results speak for themselves as he continually refines the methodology.
Alistair Strang is a freelance contributor and not a direct employee of Interactive Investor. All correspondence is with Alistair Strang, who for these purposes is deemed a third-party supplier. Buying, selling and investing in shares is not without risk. Market and company movement will affect your performance and you may get back less than you invest. Neither Alistair Strang or Interactive Investor will be responsible for any losses that may be incurred as a result of following a trading idea.
These articles are provided for information purposes only. Occasionally, an opinion about whether to buy or sell a specific investment may be provided by third parties. The content is not intended to be a personal recommendation to buy or sell any financial instrument or product, or to adopt any investment strategy as it is not provided based on an assessment of your investing knowledge and experience, your financial situation or your investment objectives. The value of your investments, and the income derived from them, may go down as well as up. You may not get back all the money that you invest. The investments referred to in this article may not be suitable for all investors, and if in doubt, an investor should seek advice from a qualified investment adviser.
Full performance can be found on the company or index summary page on the interactive investor website. Simply click on the company's or index name highlighted in the article.