FTSE 100: Path to 8,554 and spotting early signs of a sell-off
Our chartist examines index movements and where it could be heading in the long-term.
5th July 2019 09:40
by Alistair Strang from Trends and Targets
Our chartist examines index movements and where it could be heading in the long-term.

One of the more common questions being asked relates to spotting early signs of proper market reversal.
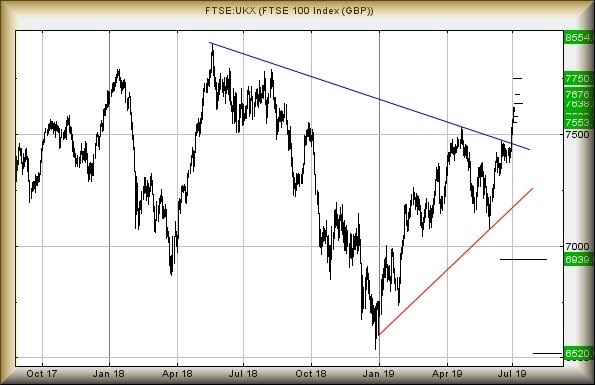
At present, the FTSE 100 requires to break red on the chart, presently at 7,170 points, to justify concern as this looks capable of driving the index back to the 6,939 level.
In itself, not the most tragic state of affairs but should 6,939 break, the index risks easily trashing itself down to 6,520 and a new low. This would prove a very bad thing.
On the FTSE for Friday, we doubt this state of affairs risks arising anytime soon as above 7,622 now looks capable of a near-term 7,638 points.
While pretty useless, secondary at 7,676 is certainly more appealing for the days ahead.
The alternate, near-term, is of weakness below 7,595 driving the index back to 7,580 initially. If broken, secondary calculates at 7,553, along with the risk of further reversals in the week ahead.
Worse still, if we examine the dire state of the US market under President Trump's domain and extrapolate a similar terrible state of affairs forward, it's remarkably easy to calculate the UK FTSE as already on course for a long-term 8,554 points.
It needs below the aforementioned red line to cancel this prospect.
Have a good weekend. At time of writing, it's 9 days and 14 hours until the British Grand Prix, along with epic traffic jams around the venue.
Source: Trends and Targets Past performance is not a guide to future performance
Alistair Strang has led high-profile and "top secret" software projects since the late 1970s and won the original John Logie Baird Award for inventors and innovators. After the financial crash, he wanted to know "how it worked" with a view to mimicking existing trading formulas and predicting what was coming next. His results speak for themselves as he continually refines the methodology.
Alistair Strang is a freelance contributor and not a direct employee of Interactive Investor. All correspondence is with Alistair Strang, who for these purposes is deemed a third-party supplier. Buying, selling and investing in shares is not without risk. Market and company movement will affect your performance and you may get back less than you invest. Neither Alistair Strang or Interactive Investor will be responsible for any losses that may be incurred as a result of following a trading idea.
These articles are provided for information purposes only. Occasionally, an opinion about whether to buy or sell a specific investment may be provided by third parties. The content is not intended to be a personal recommendation to buy or sell any financial instrument or product, or to adopt any investment strategy as it is not provided based on an assessment of your investing knowledge and experience, your financial situation or your investment objectives. The value of your investments, and the income derived from them, may go down as well as up. You may not get back all the money that you invest. The investments referred to in this article may not be suitable for all investors, and if in doubt, an investor should seek advice from a qualified investment adviser.
Full performance can be found on the company or index summary page on the interactive investor website. Simply click on the company's or index name highlighted in the article.