FTSE for Friday: good news for bitcoin and the FTSE 100?
13th May 2022 07:41
by Alistair Strang from Trends and Targets
A painful week could end on a brighter note, according to charts built by independent analyst Alistair Strang. Here are his numbers to watch on Friday.

You don’t need dig far into the news to find plenty of doom and gloom stories for cryptocurrency. Apparently, it’s “game over” and everyone involved has now lost trillions. The reality, we suspect, shall prove quite different. Firstly, no-one makes a loss until they sell (or are stopped out) and secondly, well “secondly” is curious.
The immediate bitcoin chart is, at first glance, quite interesting. On Thursday 12 May, the crypto broke the uptrend since 2020, attaining a bottom around $25,300 when the day's session effectively opened at 8am.
We’d been showing a Big Picture drop target around 27,700 on the current cycle and this, quite precisely, appeared to mesh with the Red uptrend. While the spike down early in the day to a low of 25,300 indeed broke the trend, the damage was undone by 8.45am.
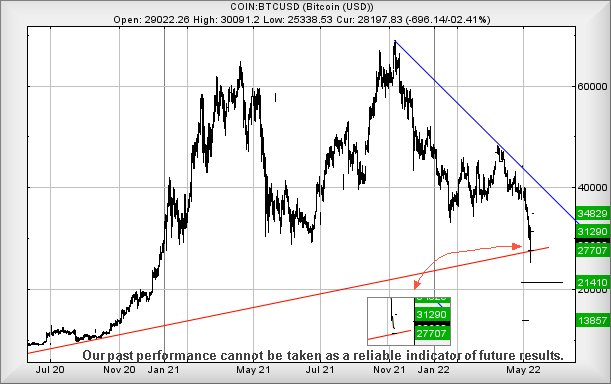
Source: Trends and Targets. Past performance is not a guide to future performance
As the chart inset highlights, bitcoin certainly interfered with the trend but appears extremely unlikely to close the day below our drop target level. As a result, we’re inclined to anticipate some near term recovery, as above 29,900 now looks capable of an attempt at an initial 31,290 with secondary, if bettered, a slightly more inspiring 34,800.
It’s certainly an ongoing concern as the market “proved” at 8am the 2020 Red uptrend can be broken, but visually it appears unlikely this initial damage is intended to last.
However, to jump on the misery bandwagon, we’d now warn that below 25,300 calculates with the risk of reversal now to an initial 21,400 with secondary, if broken, at 13,800 and a return to levels not seen since just 18 months ago.
FTSE for Friday
Yet again, we’re stumbling into a Friday feeling uncertain as to just what the heck is going on. It’s supposed to be the case of weakness below 7,158 points now generating reversal to an initial 7,090 points with secondary, if broken, a hopeful bottom at 7,004 points.
Unfortunately, there’s quite a strong visual case demanding a bottom at the 7,004 point level, thanks to the presence of the Red pandemic trend line. This almost jars with a nice letter received today from Scotland’s fragrant Nicola Sturgeon, effectively letting me know the pandemic shall be deemed “over” from the end of this month, thanks to plentiful supply of treatments for anyone experiencing Covid-19.
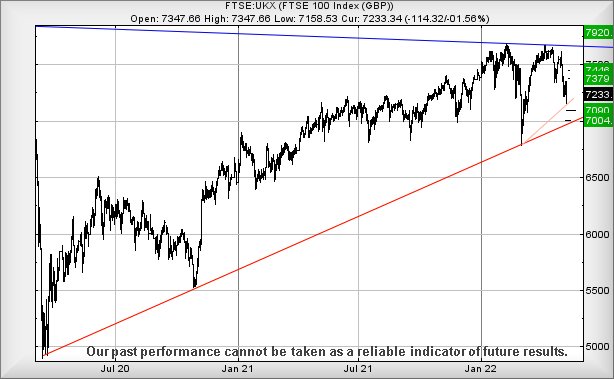
Source: Trends and Targets. Past performance is not a guide to future performance
It begs the question, should we now disregard the pandemic trend and instead worry about the Russia trend since March?
But the level of surprise recovery shown during Thursday produced a near-term trigger level and, with the market closing the session at 7,233 points, very little work needs to be done to give some near-term hope.
Above just 7,278 points is supposed to trigger ongoing recovery to an initial 7,379 points, a tidy 100-point boost capable of making the chaos of this week feel like a painful memory. Above 7,379 and we can calculate a secondary target at 7,446 points.
Alistair Strang has led high-profile and "top secret" software projects since the late 1970s and won the original John Logie Baird Award for inventors and innovators. After the financial crash, he wanted to know "how it worked" with a view to mimicking existing trading formulas and predicting what was coming next. His results speak for themselves as he continually refines the methodology.
Alistair Strang is a freelance contributor and not a direct employee of Interactive Investor. All correspondence is with Alistair Strang, who for these purposes is deemed a third-party supplier. Buying, selling and investing in shares is not without risk. Market and company movement will affect your performance and you may get back less than you invest. Neither Alistair Strang or Interactive Investor will be responsible for any losses that may be incurred as a result of following a trading idea.
These articles are provided for information purposes only. Occasionally, an opinion about whether to buy or sell a specific investment may be provided by third parties. The content is not intended to be a personal recommendation to buy or sell any financial instrument or product, or to adopt any investment strategy as it is not provided based on an assessment of your investing knowledge and experience, your financial situation or your investment objectives. The value of your investments, and the income derived from them, may go down as well as up. You may not get back all the money that you invest. The investments referred to in this article may not be suitable for all investors, and if in doubt, an investor should seek advice from a qualified investment adviser.
Full performance can be found on the company or index summary page on the interactive investor website. Simply click on the company's or index name highlighted in the article.