Is the future of income emerging?
We ask if dividend investors should consider diversifying into emerging markets.
27th March 2024 11:11
by Matt Williams from Aberdeen

What comes to mind when you think of income investing? Probably mature companies, legacy industries, developed markets, and low growth.
While a traditional developed market equity income strategy still has its place in portfolios, we believe there is a compelling case for diversification into emerging markets (EM).
Once seen as offering slim pickings for dividend investors, today’s EM universe provides an incredibly varied and attractive income hunting ground as its capital markets deepen.
Dividend data
The number of EM companies paying a dividend grew significantly in the ten years from 2001-2011*. In fact, ~90% of companies in EM now pay dividends*.
As you can see in Chart 1, the same proportion of companies in EM pay a dividend when compared to developed markets (DM) (Jefferies, January 2024). Perhaps more significantly, nearly 40% of companies in EM pay a dividend over 3% (Bloomberg, October 2023).
Chart 1: MSCI universe – companies paying dividends
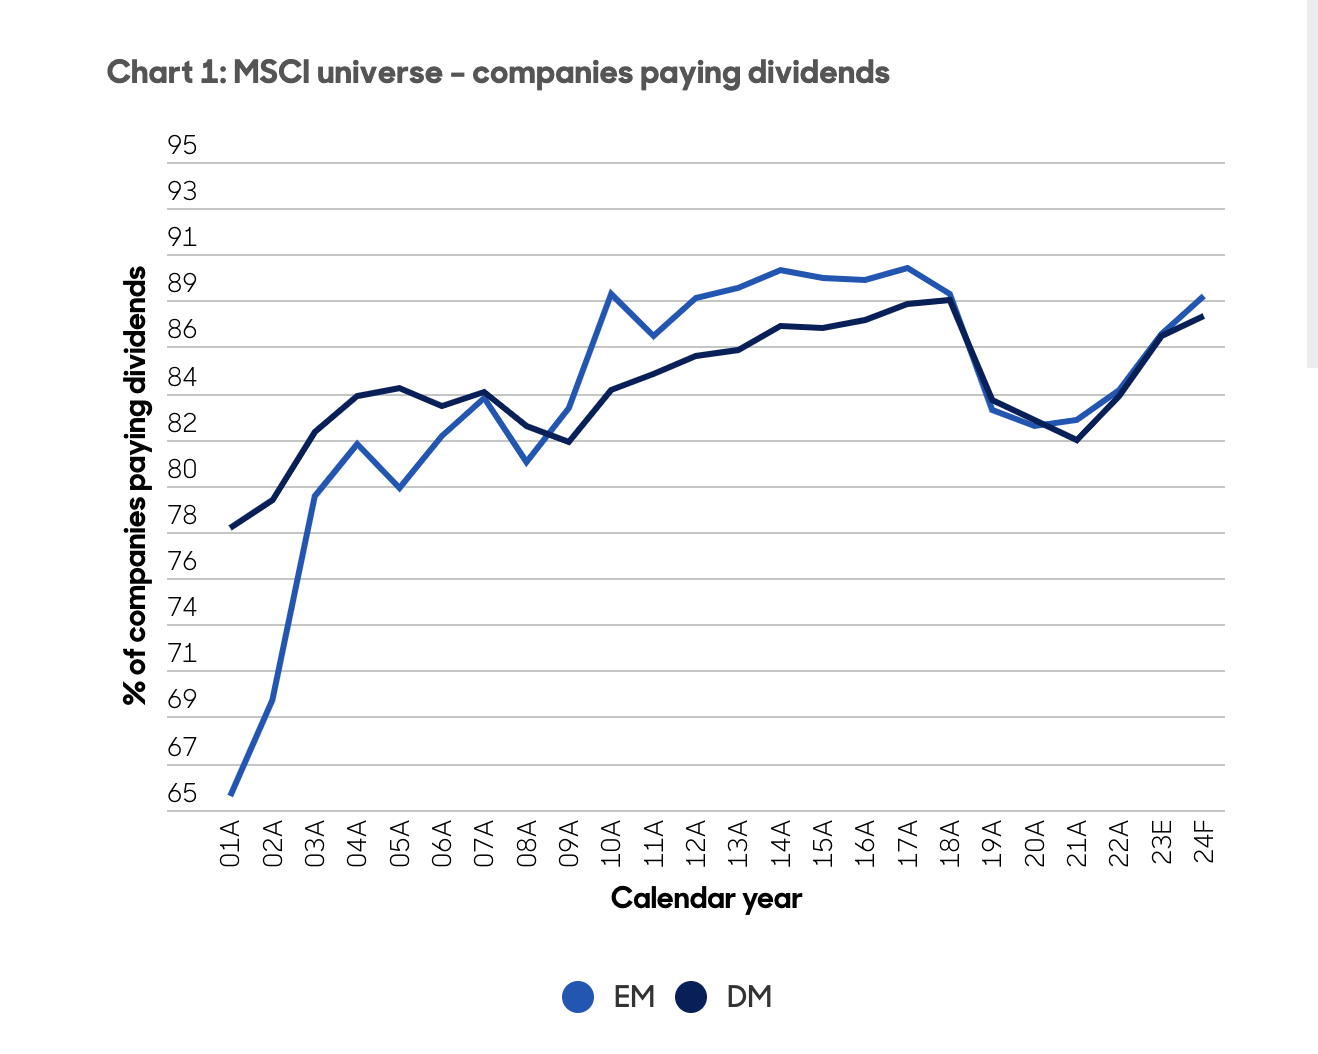
The proportion of EM companies with dividends increased significantly during the start of the previous decade
Using MSCI universe as it existed in the past. Based on local currency performance. Gross reinvested dividends without considering the impact of taxes. For illustrative purposes only. Past performance is not a guide to future performance. Source: FactSet, Jefferies Equity Research, January 2024.
In our view, paying a dividend signals a shareholder-driven mindset on the part of company management, and a discerning approach to capital allocation.
In EM, yield doesn’t preclude growth
It's not uncommon for investors to assume that because income strategies are sometimes associated with mature companies, dividend investing means missing out on growth opportunities.
However, we believe that in EM this is not the case. Strong corporate fundamentals and good underlying economic growth mean dividends have grown significantly faster in EM versus DM since the early 2000’s. This has resulted in a compound annual growth rate (CAGR) of c.12% over the last 20 years, is illustrated in Chart 2.
Chart 2: MSCI regions - dividend growth since 2003
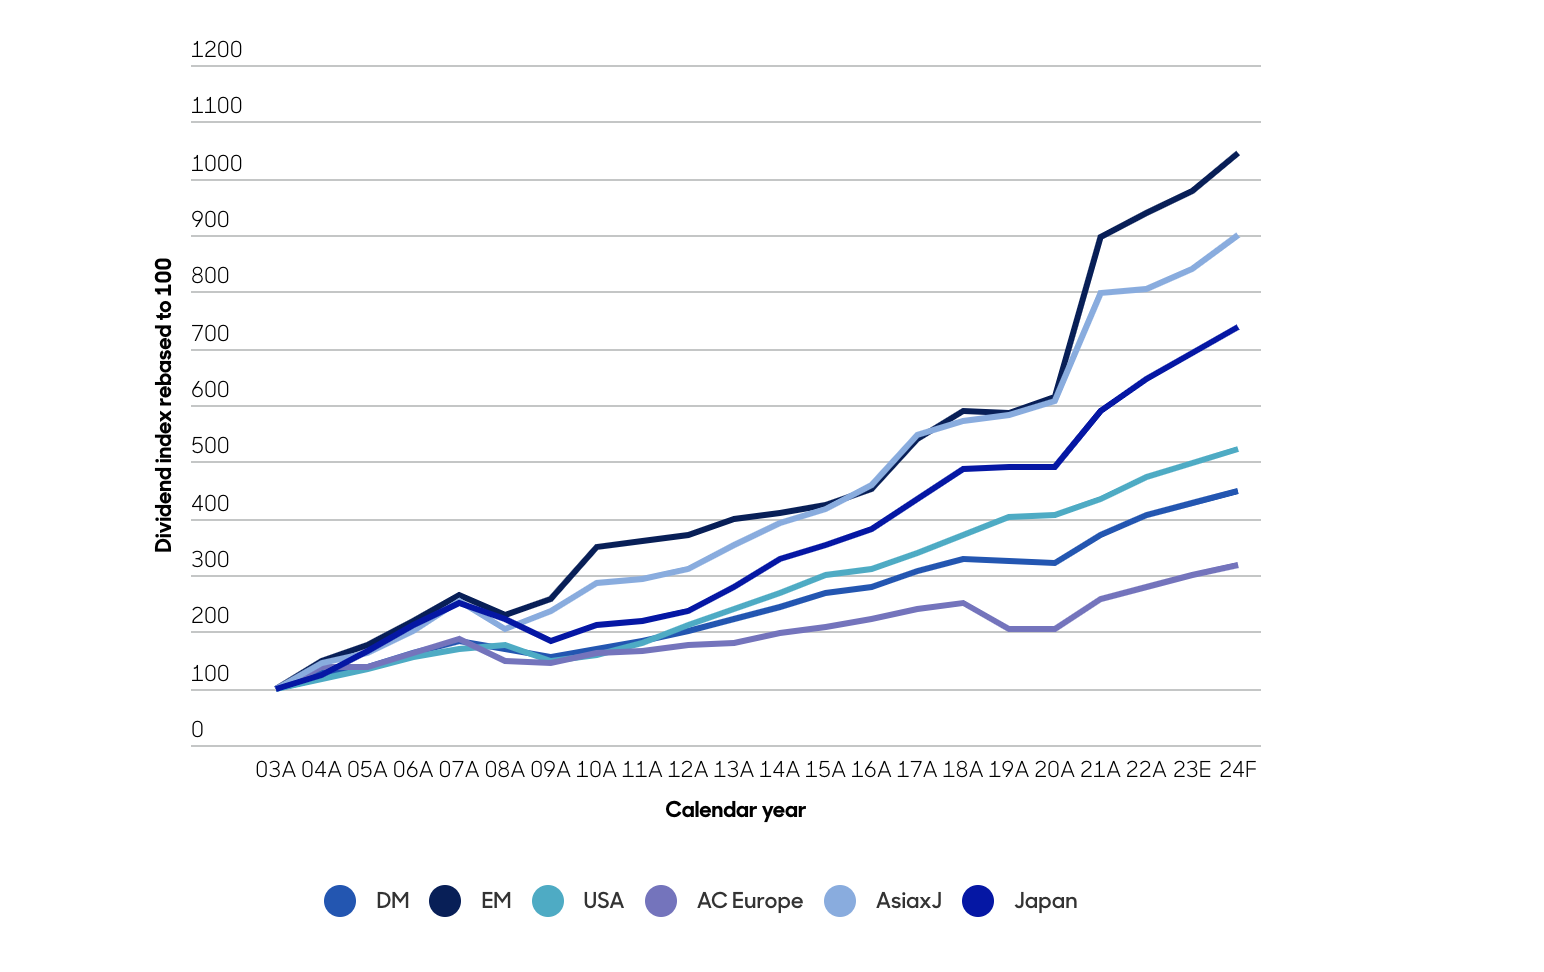
Last 20 years dividend CAGR (03A-22E):
DM = 7.5% EM = 12.1% USA = 8.3% AC Europe = 5.7% AsiaxJ = 11.2% Japan = 10.2%
Dividend index rebased to 100 (local currency, current universe). Bottom-up aggregated with free float adjustment in a year-on-year like-to-like basis for the current MSCI universe. Source: FactSet, Jefferies Equity Research, January 2024. For illustrative purposes only. Past performance is not a guide to future performance.
Dividend delivery
Although it's well understood by many investors that income is a critical part of returns over time, this is something that may have been given less consideration in an EM context.
Nonetheless, the opportunity is just as relevant for companies in EM as it is for DM. Chart 3 displays the two components behind the MSCI EM Index’s total return over the last 22 years - price return and dividends.
The chart shows that dividend returns in EM since 2000 have been one of highest relative to other regions. The price return component representing half of investor returns is dominated by earnings growth which in turn drives dividend growth. The other half of investor returns has come from the compounding effect of dividend payments.
The growth of earnings and the compounding of dividends in EM means active investors can combine dividend growth and high income, sometimes in a single stock. The superior growth characteristics of EM dividends (both from underlying growth of cash flows, plus rising payouts) is a trend we expect to continue.
Additionally, the coverage of dividends in EM tends to be superior, with healthier balance sheets providing further support for the growth of payout ratios.
Chart 3: MSCI regions - % local currency total returns since December 2000
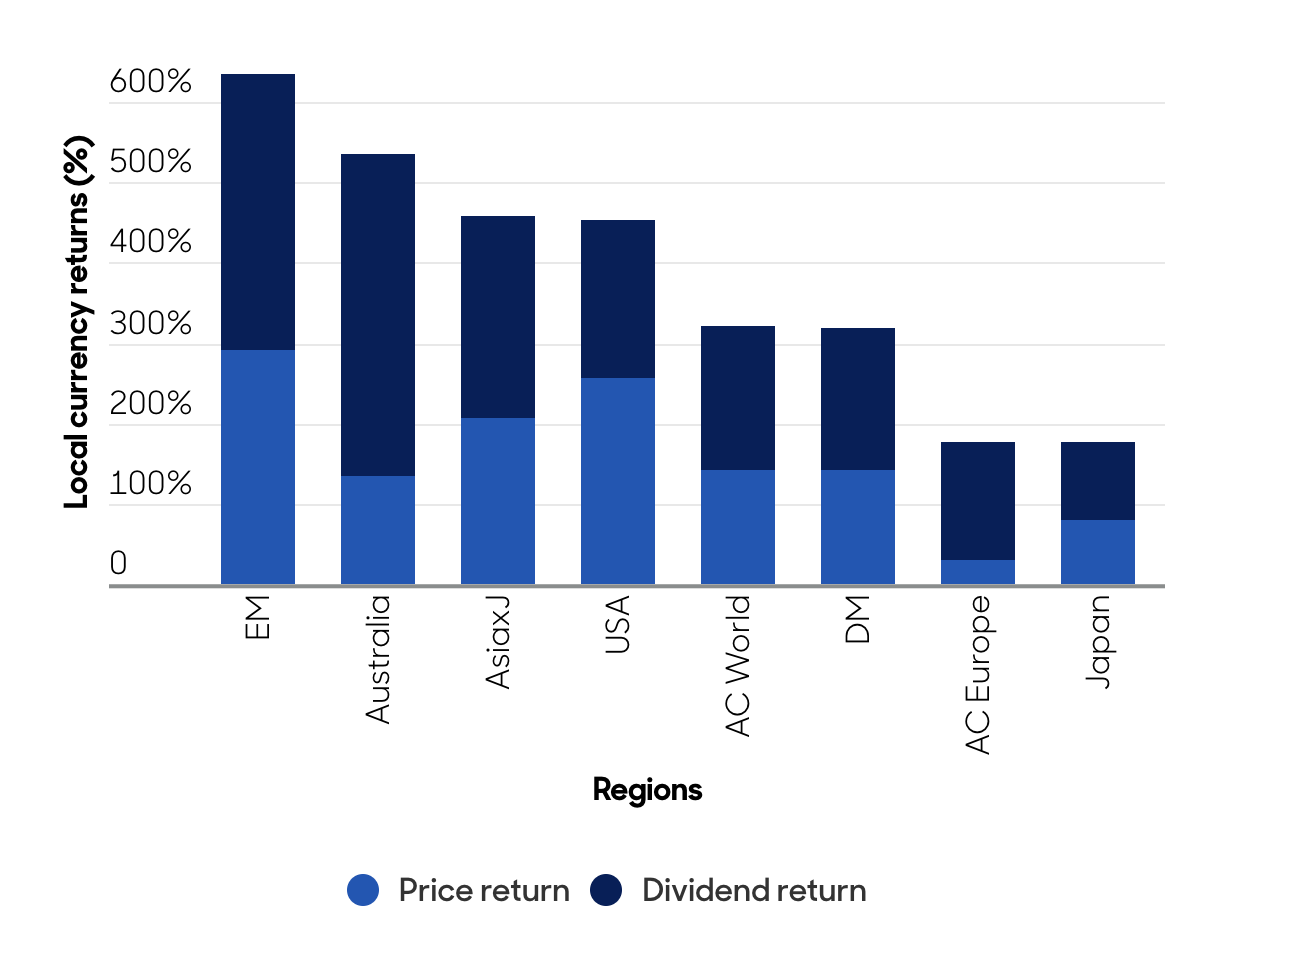
EM, Asia ex-Japan and Australia have the highest dividend contribution to their total return since Dec 2000
Using MSCI universe as it existed in the past. Based on local currency performance. Gross reinvested dividends without considering the impact of taxes. Source: FactSet, Jefferies Equity Research, January 2024.
Final thoughts
We believe the EM universe offers diverse income opportunities across sectors and geographies, as well as dynamic companies with the potential to generate valuable investment outcomes for clients.
What’s more, the trends discussed in this article would seem to further strengthen the investment case, suggesting the asset class might be particularly attractive for active income investors seeking a strong total return.
*Source: Jefferies, January 2024
Matt Williams is a senior investment director at abrdn.
ii is an abrdn business.
abrdn is a global investment company that helps customers plan, save and invest for their future.
These articles are provided for information purposes only. Occasionally, an opinion about whether to buy or sell a specific investment may be provided by third parties. The content is not intended to be a personal recommendation to buy or sell any financial instrument or product, or to adopt any investment strategy as it is not provided based on an assessment of your investing knowledge and experience, your financial situation or your investment objectives. The value of your investments, and the income derived from them, may go down as well as up. You may not get back all the money that you invest. The investments referred to in this article may not be suitable for all investors, and if in doubt, an investor should seek advice from a qualified investment adviser.
Full performance can be found on the company or index summary page on the interactive investor website. Simply click on the company's or index name highlighted in the article.