Here's what the FTSE 100 could do this Easter
After posting cautious gains through the first half of April, our chartist looks for signs of trouble.
18th April 2019 10:33
by Alistair Strang from Trends and Targets
After posting cautious gains through the first half of April, our chartist looks for signs of trouble.

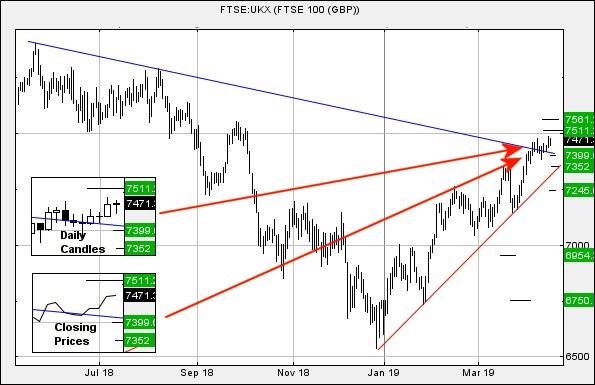
FTSE for Thursday (FTSE:UKX)
As the market is closed on Friday, due to everyone eating chocolate, we've opted to end the trading week with our usual look at FTSE 100 index's near-term potentials.
April has proven to be less than impressive, doubtless due to politicians unable to roll away the stone blocking a sane conclusion to the reality of Brexit.
The immediate situation for the FTSE appears quite straightforward. Moves now exceeding 7,480 should bring continued recovery to an initial 7,511 points. If exceeded, our secondary calculation is at 7,561, along with some stumbles. Tightest stop looks like 7,444 points.
If trouble is coming - which actually looks possible for Thursday - reversal below 7,444 points looks capable of travelling down to an initial 7,399 points. If broken, our secondary calculation is at 7,352 points.
It's fairly important to remember the uptrend for 2019 is presently lurking at 7,328 points with weakness below such a level looking capable of a sharp 80-point fall to around 7,245 points!
For light relief, or more probably because it's important, we've given a couple of insets on the chart. These insets show what's happened since it became clear Brexit was being delayed.
The UK market has reacted very, very, carefully, with a lack of flamboyance seen on other markets in Europe and the USA.
The respect being paid to the ruling 'blue' downtrend is fairly important as it implies weakness now below ‘blue’ is liable to provoke sharp reversals.
Essentially, this is our doctrine of "If it ain't goin' up, it's goin' down" in action. Despite our speculative trading scenario above, the blue line advocates extreme caution if the index slides below - presently 7,417 points.
Have a good Easter.
Source: TradingView Past performance is not a guide to future performance
Alistair Strang has led high-profile and "top secret" software projects since the late 1970s and won the original John Logie Baird Award for inventors and innovators. After the financial crash, he wanted to know "how it worked" with a view to mimicking existing trading formulas and predicting what was coming next. His results speak for themselves as he continually refines the methodology.
Alistair Strang is a freelance contributor and not a direct employee of Interactive Investor. All correspondence is with Alistair Strang, who for these purposes is deemed a third-party supplier. Buying, selling and investing in shares is not without risk. Market and company movement will affect your performance and you may get back less than you invest. Neither Alistair Strang or Interactive Investor will be responsible for any losses that may be incurred as a result of following a trading idea.
These articles are provided for information purposes only. Occasionally, an opinion about whether to buy or sell a specific investment may be provided by third parties. The content is not intended to be a personal recommendation to buy or sell any financial instrument or product, or to adopt any investment strategy as it is not provided based on an assessment of your investing knowledge and experience, your financial situation or your investment objectives. The value of your investments, and the income derived from them, may go down as well as up. You may not get back all the money that you invest. The investments referred to in this article may not be suitable for all investors, and if in doubt, an investor should seek advice from a qualified investment adviser.
Full performance can be found on the company or index summary page on the interactive investor website. Simply click on the company's or index name highlighted in the article.