How is fund manager appetite for gearing amid rising rates?
A Kepler analyst considers gearing levels at a range of investment trusts, including widely held Scottish Mortgage.
6th October 2023 14:03

This content is provided by Kepler Trust Intelligence, an investment trust focused website for private and professional investors. Kepler Trust Intelligence is a third-party supplier and not part of interactive investor. It is provided for information only and does not constitute a personal recommendation.
Material produced by Kepler Trust Intelligence should be considered a marketing communication, and is not independent research.
Across the world, interest rates have risen rapidly. The graph below shows just how dramatic this change has been, and clearly indicates we are in a new chapter of economic history. That said, with inflation now falling, there are already commentators who are calling the top of interest rates for this cycle. Time will tell, but the downward-sloping yield curve, as at 31 August 2023, indicates that the market agrees.
INTEREST RATES HAVE INCREASED MARKEDLY
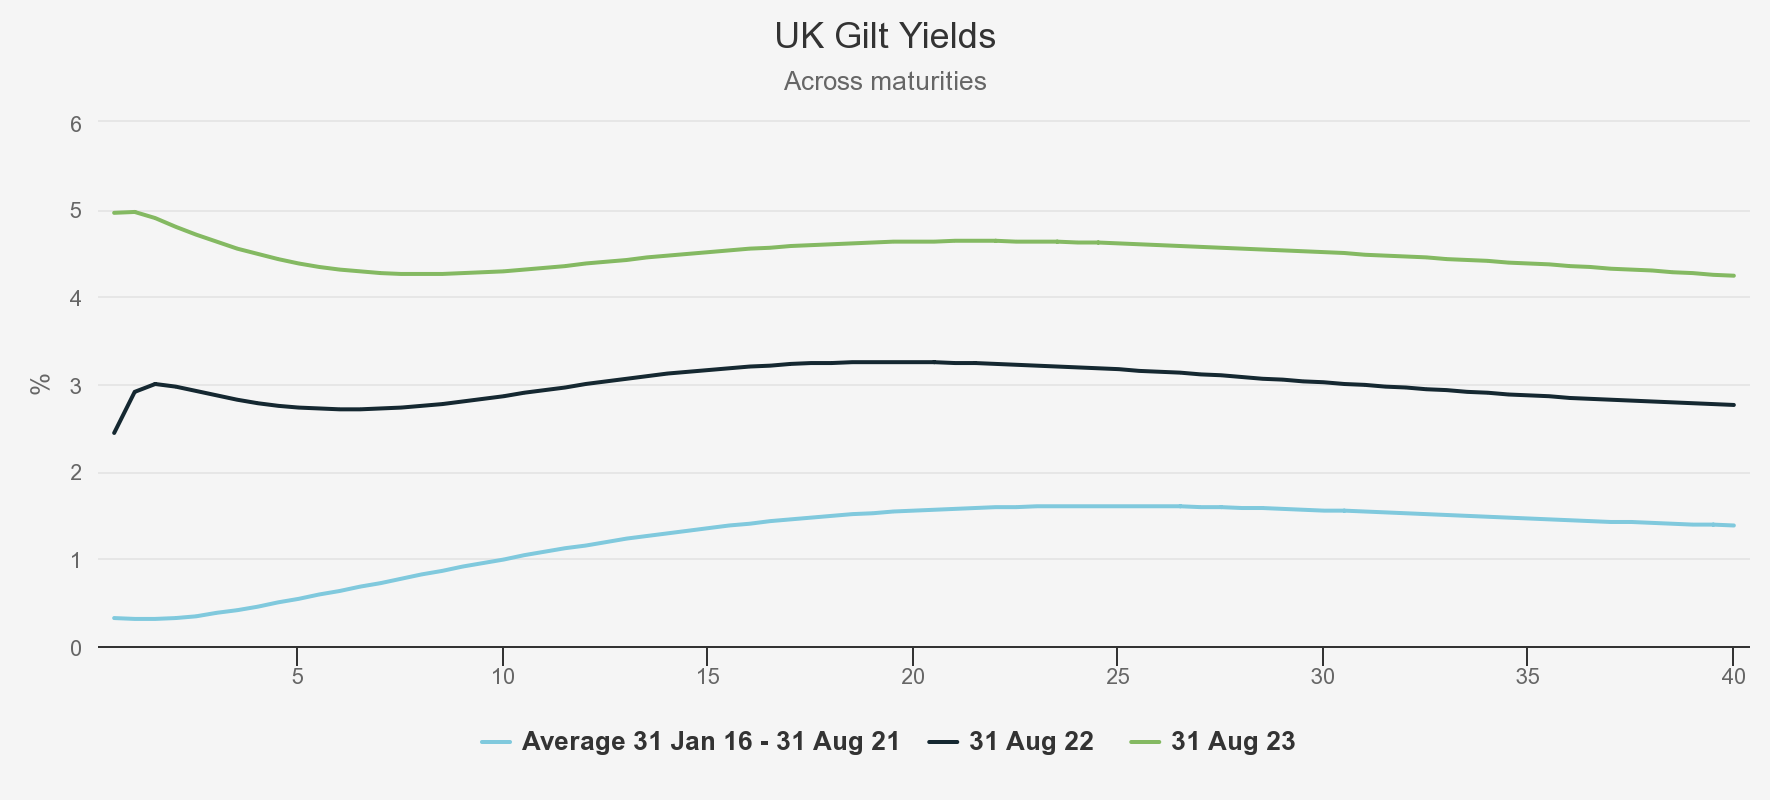
Source: Bank of England
In the graph above, the lowest line takes the average yield to maturity for gilts over the period from the start of 2016 to mid-2021, a period characterised by historically low interest rates. Over this time, according to data from the AIC, investment trust boards seized the opportunity and locked in a total of £4.1 billion of fixed-rate borrowings at low rates, fixed for a minimum of two years. With interest rates as low as they were, in hindsight it seems like a no-brainer. However, different trusts have different balance sheets and different circumstances. Employing long-term fixed-rate gearing is not necessarily for everyone, as many trusts that bore the scars can attest, and decisions on fixed-rate borrowings can have reverberations for years. Bankers (LSE:BNKR, for example, will, at the end of October 2023, be celebrating the repayment of an 8% debenture stock. This was originally drawn down in 1993 and will have provided something of a drag on income returns over recent times.
However, while there may have been trust-specific reasons to avoid gearing, given the very low interest costs at the time, boards did not have to weigh very carefully the interest-cost impact on future returns. That has now changed, so we thought it interesting to discuss what nuances investors, boards or managers of investment trusts now have to consider, and see whether higher costs of borrowing are actually having an impact on gearing levels in practice.
Caveat emptor
As we all know, past performance is no guide to future returns. This is especially the case for those trusts which secured ultra-low fixed-interest borrowings for the long term. Over the last couple of years, these trusts will have had a decent following wind in terms of their performance track records, when expressed as ‘NAV with debt at market’. The NAV with debt at market (or Cum Fair), in our view, is more commonly used than ‘NAV with debt at par’, given that it effectively gives you the break-up value of a trust. If fixed-rate debt is taken out at one rate, and market rates subsequently move, the ‘value’ of that debt changes. It can work both ways. So, if borrowings are fixed at 5% and rates subsequently move to 2%, the value of the debt increases to reflect the higher coupon, reducing the NAV of a trust in this scenario. More analogous to the situation that many trusts currently find themselves in, if fixed-rate borrowings are established at 2%, but rates for the same term of loan move to 5%, the value of the debt falls and the NAV increases. The table below shows trusts within the three main AIC sectors that we look at in this analysis, namely Global, UK Equity Income and Europe, highlighting the effect of the rise in interest rates on the mark-to-market value of the fixed-rate debt held on their balance sheets. In total, the trusts in this sample have benefitted to the tune of £1 billion, representing circa 3% of the current net asset value of all these trusts.
Aside from being a helpful contributor to returns, it is worth highlighting that this is a one-off contribution to investors, which will not repeat. Investors comparing relative performance using NAV with debt at market over this period need to consider what the contribution to returns has been and adjust in any relative analysis, or compare manager track records on a NAV with debt at par basis. It is also worth remembering, for long-term investors, that this tailwind will turn into a headwind over the term of the debt, given debt is repayable at par and the positive effect will reverse as the debt maturity approaches.
VALUATION IMPACT ON SAMPLE OF FIXED-RATE BORROWERS
| NAME | FIXED GEARING AS % OF NAV | NAV UPLIFT (£M) FROM DEBT MARKED AT FAIR VALUE | % OF CURRENT NAV | CURRENT NET GEARING % | FLOATING RATE DEBT / (CASH) % OF NAV |
| AVI Global | 9.5 | 14.0 | 1 | 6 | -3.5 |
| Alliance Trust | 4.5 | 18.3 | 1 | 4 | -0.5 |
| Baillie Gifford European Growth | 9.6 | 17.9 | 5 | 9 | -0.6 |
| Brunner | 3.0 | 9.2 | 2 | 4 | 1.0 |
| City of London | 4.1 | 32.7 | 2 | 4 | 0.1 |
| Edinburgh | 6.0 | 49.4 | 4 | 4 | -2.0 |
| F&C Investment Trust | 7.5 | 205.9 | 4 | 5 | -2.5 |
| JPMorgan Claverhouse | 5.2 | 8.2 | 2 | 6 | 0.8 |
| Law Debenture | 11.6 | 43.4 | 4 | 8 | 3.6 |
| Monks | 1.9 | 52.6 | 2 | 3 | 1.1 |
| Merchants | 6.6 | 12.3 | 2 | 11 | 4.4 |
| Murray Income | 9.1 | 18.0 | 2 | 10 | 0.9 |
| Scottish Mortgage | 10.3 | 409.7 | 4 | 10 | -0.3 |
| Temple Bar | 7.8 | 16.3 | 2 | 8 | 0.2 |
| Witan | 6.2 | 57.1 | 4 | 12 | 5.8 |
| Total | 965.0 | 3 |
Source: AIC, JPMorgan Cazenove, as at 29/09/2023
We think it interesting that in the majority of cases, namely 10 out of 15, trusts which have fixed-rate gearing employ only that fixed-rate gearing, and either do not have flexible gearing facilities or have chosen not to draw them down at the current time. Others, such as AVI Global Trust (LSE:AGT), are consciously holding cash on the balance sheet against their fixed-rate borrowing, reducing the gearing effect. In our view, this suggests boards and managers are cognisant of borrowing costs, and have acted to draw their necks in. Should short-term interest rates fall, it may prompt managers to get back into the market.
Cost benefit
When taking on floating-rate gearing, it now likely involves a much more finely balanced discussion on cost vs benefit. Long-term returns from equity markets – depending on which equity market you take – are traditionally understood to be high single-digit percentages in nominal terms. Investment trusts borrowing short-term at floating rates involves paying a negotiated margin over SONIA (Sterling Overnight Index Average). We understand that this margin tends to be in the range of 0.8% - 1.2%, although is sometimes more, depending on the credit quality and negotiating power of the trust in question. With SONIA currently at 5.2%, according to the Bank of England, trusts that are borrowing short-term must be paying interest north of 6%.
Whilst the interest costs are clearly defined, the benefits from employing gearing are clearly not. Long-term returns from equities may exceed current borrowing costs, but potentially not by much. Managers may see stocks as attractively valued and offering significantly higher returns on a long-term total-return basis. However, what if they are wrong? Well, employing short-term gearing will have proved an expensive mistake. And either way, it will add to NAV volatility, which is another cost. We think it is an uncontroversial theoretical point that the more volatile a NAV is, the wider the discount, all things being equal. When we spoke to Job Curtis, manager of City of London (LSE:CTY), recently, he commented that with interest rates on short-term borrowings elevated, he was not employing any of his facility. CTY remains geared through its long-term fixed-rate debt.
By this measure, if trusts haven’t secured fixed-rate borrowings, why are trusts continuing to use gearing? As with anything in life, things aren’t necessarily quite as simple as they first appear. Firstly, gearing will contribute to dividend cover, even in the current environment of higher interest rates, making degearing unattractive, given that it will result in lower revenues and more pressure on a trust’s ability to pay the same, or a higher, dividend than last year. Accounting rules muddy the picture somewhat. Trusts allocate management fee and interest costs between income and capital, depending on what the boards see as the long-term split of expected returns. In the sample of trusts that we show above, on average, c. 70% of costs are charged to capital.
The simple maths that results is as follows. If the portfolio yield is 5% and the interest cost is 6%, gearing can still add to dividend cover because only 30% of the interest cost is charged to the income account. So, for every £100 of gearing employed, the net contribution to the income account is 5% less 1.8% (being 30% of 6%), equalling 3.2%, or £3.20. However, the catch is that the capital account has to bear the brunt of the interest costs, meaning that capital growth will be that much harder to achieve. The total returns to shareholders will be the same, but with more income at the expense of capital returns.
For trusts that have a dividend cover to maintain, cutting gearing because of higher interest costs could, therefore, have a deleterious effect on revenues. Over the long term, it may be that such an investment trust may find itself worse off depending on the direction that markets take, but over the short term, a more immediate worry is assuaged – in that at least dividend cover should hopefully be maintained, and certainly won’t suffer a one-off decline that would be the result of paying back borrowings.
Gearing in practice
So, what do the statistics tell us? One might imagine that investment trust managers have adapted to higher interest rates and reduced gearing. The above table would suggest that they have. However, this subset of trusts are those that have already locked in fixed-rate borrowings and, therefore, have the luxury of choice. What have trusts, in general, been doing?
We have taken Morningstar’s net gearing series for each trust in each of three large sectors and created a simple average of their gearing levels over the past five years. Data generally only gets published monthly, but Morningstar estimate gearing levels every day based on changes to NAVs, so the data needs to be taken with a pinch of salt. However, the graph below illustrates that during Q1 2020, when the pandemic first hit, gearing levels rose as a result of sharply falling equity markets. It is hard to be precise, but it would appear that, generally, managers reduced gearing at this time, but maintained gearing at a level such that they participated in some of the bounce-back. Generally, our house view is that managers should not try to time markets or be reactive when it comes to gearing, but take the long view and employ it constantly and consistently. That said, it is easier said than done, especially when one remembers the panic and confusion in markets in February and March 2020. 2022 was an annus horribilis for almost all fund managers, other than those invested in UK ‘sin stocks’, such as energy and defence. We think it curious that gearing generally fell across the three sectors, even as NAVs were falling. One might expect managers with conviction to add to stocks as they became cheaper. However, interest rates were rising over this period, so perhaps the reduction in gearing represents this fact, as well as the looming potential for a global recession.
Perhaps perversely, gearing across all three sectors has increased over the last 12 months, indicating higher risk appetites despite higher borrowing costs. In our view, given the following wind that gearing has on income accounts that we discuss above, it is unsurprising that the UK equity-income sector has had a consistently higher level of gearing than the other two sectors in the graph below. One might also argue that UK equity-income portfolios, which can be represented as shorter-duration investments when compared to high-beta growth portfolios, can bear higher gearing given their lower betas. It is interesting in the context of higher rates that the gap in gearing levels between UK equity income and the other two sectors has been narrowing.
GEARING LEVELS ACROSS SECTORS
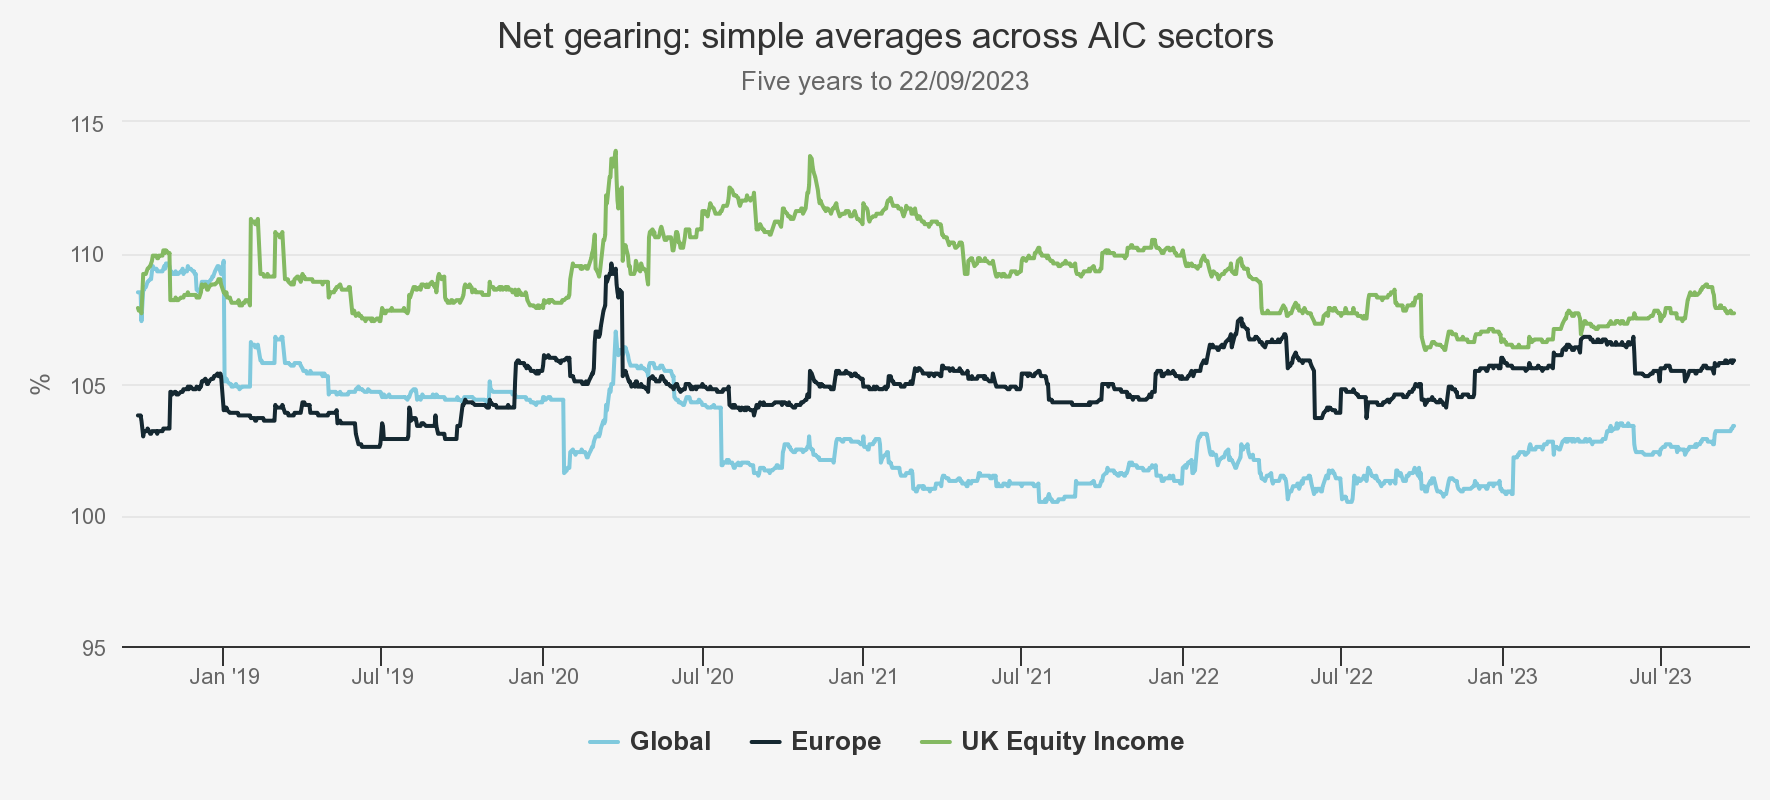
Source: Morningstar, Kepler Partners
Next, we look at the individual constituents of each of the sectors, highlighting in the tables below those trusts which are, according to Morningstar statistics, currently outside of their normal range of gearing, as measured by the standard deviation from the average. Overall, UK equity-income trusts currently appear to be less geared than their average, over the last five years. Within the group, there are clear outliers. We would note, in particular, CTY referred to above and JPMorgan Claverhouse (LSE:JCH), the managers of which we met recently. JCH’s fixed gearing comprises £30m of nominal value and it has access to a flexible facility, too. The managers have said that they remain cautiously optimistic given UK valuations, hence they have gearing below the 10% level that the board and manager see as a neutral level. Both CTY and JCH are longstanding dividend heroes, with significant revenue reserves at hand, which gives the managers flexibility to set gearing as they see fit without having to worry about the impact on the revenue account of running with lower levels of gearing.
On the other hand, CT UK High Income (LSE:CHI) has a new manager behind it in the form of the highly experienced David Moss. CHI has a fully flexible gearing facility. David’s predecessor timed a reduction in gearing well, taking it significantly down at the start of 2022, and reducing further. He then reapplied gearing as 2023 developed and, in his view, rate expectations started to peak. David has continued to deploy capital, finding plenty of highly attractive opportunities in what he sees as a depressed UK market. As a result, CHI is well north of one standard deviation in terms of gearing. We will publish an updated profile on CHI soon, following our first meeting with David as manager. Click hereto be notified when it is published.
UK EQUITY INCOME SECTOR: GEARING OUTSIDE NORMAL LEVELS
| LATEST GEARING | CURRENT LEVEL OF GEARING FLOATING / FIXED | RELATIVE TO FIVE-YEAR AVERAGE (% POINTS) | RELATIVE TO -1 STD DEV (% POINTS) | RELATIVE TO +1 STD DEV (% POINTS) | ||
| Murray Income | 105.3 | Fixed | -6.1 | -3.8 | - | |
| City of London | 103.7 | Fixed | -5.6 | -3.0 | - | |
| Merchants | 110.4 | Fixed | -6.4 | -0.8 | - | |
| JPMorgan Claverhouse | 106.3 | Fixed | -6.0 | -0.4 | - | |
| Edinburgh | 104.2 | Fixed | -3.0 | -0.2 | - | |
| Troy Income & Growth | 101.1 | Floating | 3.0 | - | 0.9 | |
| abrdn Equity Income | 116.1 | Floating | 3.5 | - | 1.7 | |
| CT UK High Income | 113.4 | Floating | 7.8 | - | 4.1 |
Source: Morningstar, Kepler Partners, as at 29/09/2023
In the global sector, shown below, most trusts are within their usual range of gearing. There are some exceptions. Mid Wynd International Inv Trust (LSE:MWY) is undergoing a change of manager, so we understand that until the new manager has their feet under the desk, the board has decided not to renew the credit facility. We hope to publish an updated profile very soon, following a meeting with the new management team. Click here to be alerted when it is published.
Martin Currie Global Portfolio (LSE:MNP) took out a £30 million loan in 2019, with a fixed three-year interest rate of 1.181%. It has been fully drawn down over this period. MNP’s optically high gearing relative to the five-year history is in the context of not having had any gearing prior to 2019. With the facility due to expire in November 2023, we expect this will be an interesting case study in whether a new facility, presumably at significantly higher interest rates, will be employed.
GLOBAL SECTOR
| LATEST GEARING | CURRENT LEVEL OF GEARING FLOATING / FIXED | RELATIVE TO FIVE-YEAR AVERAGE (% POINTS) | RELATIVE TO -1 STD DEV (% POINTS) | RELATIVE TO +1 STD DEV (% POINTS) | |
| Mid Wynd International | 96.7 | Fixed | -3.2 | -1.0 | - |
| Alliance Trust | 104.0 | Fixed | -2.1 | -0.4 | - |
| F&C Investment Trust | 104.7 | Fixed | -3.2 | -0.1 | - |
| Martin Currie Global Portfolio | 111.8 | Fixed | 7.0 | - | 1.7 |
| Bankers | 109.4 | Fixed | 6.0 | - | 2.6 |
Source: Morningstar, Kepler Partners, as at 29/09/2023
European investment trust managers appear to be significantly more bullish than their counterparts elsewhere. On average, they are 1% more highly geared now than their five-year average, with no trusts below their -1 standard deviation boundary. Those European managers who have floating-rate gearing, particularly as income isn’t necessarily a focus within this peer group, must be bullish. Most European managers we’ve met in recent months wouldn’t go as far as saying that their higher gearing is an indication of bullish sentiment towards markets, but when pressed, they mostly agree that the rise is a function of finding more opportunities at lower valuations, with most of them making the point that European equities on average are at very attractive levels compared to other markets and compared to history.
EUROPE SECTOR
| LATEST GEARING | CURRENT LEVEL OF GEARING FLOATING / FIXED | RELATIVE TO FIVE-YEAR AVERAGE (% POINTS) | RELATIVE TO -1 STD DEV (% POINTS) | RELATIVE TO 1 STD DEV (% POINTS) | |
| European Smaller Companies | 113.9 | Floating | 3.0 | - | 0.8 |
| Baillie Gifford European Growth | 108.5 | Fixed | 4.0 | - | 0.2 |
| Fidelity European | 114.2 | Floating (CFD) | 4.0 | - | 1.4 |
Source: Morningstar, Kepler Partners, as at 29/09/2023
Conclusion and outlook
Overall, after a period of degearing during 2022, trusts’ managers appear to be adding to gearing so far this year, despite higher interest rates.
That said, our analysis seems to point to the fact that higher rates have had an impact on managers’ enthusiasm for gearing, but only where trusts have a combination of fixed and floating-rate borrowings. This has particularly been the case in the UK equity-income sector, which has traditionally had significantly higher gearing than the other two sectors we compare against. Managers are more lowly geared in this sector compared to the five-year average, but there are outliers. The managers who have pared gearing back the most are those who manage trusts which have a mix of fixed and floating. We hazard that they are thus able to maintain an element of gearing, but are choosing to avoid the significantly higher interest costs that come with floating-rate borrowings. On the other hand, trusts in this sector which have the highest levels of gearing relative to their five-year history all have entirely flexible borrowing facilities. The managers here appear to be doubling down on attractive valuations, but also maximising the potential to generate revenues and provide covered dividends. There are risks to such an approach and time will tell whether these managers were right to maintain gearing, despite higher interest costs.
The picture in the global sector is much more nuanced, and there appear to be no firm conclusions to be made, with gearing levels very much in line with historical averages. To some extent, the preponderance of fixed borrowings in this sector perhaps explains this, with managers tending not to look at gearing being applied dynamically. In Europe, managers appear bullish, with most trusts either in line with averages or at the higher end of the range. With less emphasis on generating revenues to pay dividends in this sector, this must reflect conviction in the underlying attractiveness of companies’ potential to deliver strong total returns in the future.
A final thought for investors is to pay close attention to the term of borrowing facilities. This is a consideration across sectors, but arguably is more important for equity-income sectors. The decision about whether to repay or extend borrowings is likely to be weighed more keenly, given the impact on dividend cover – either from degearing or from adding higher interest costs into the equation. We show below the trusts which have fixed-rate borrowings maturing in the next three years. Assuming interest rates remain at current levels, where the coupon rate is currently high, this will be a clear positive if the board is able to refinance. On the other hand, those trusts which are currently paying a low coupon may have a tougher decision to make about whether to refinance or just repay. So far, according to the data from the AIC, in this higher-rate environment, no trusts have yet bitten the bullet and taken out long-term fixed-rate borrowings.
TRUSTS WITH FIXED-RATE BORROWINGS MATURING WITHIN THREE YEARS
| TRUST | £ NOMINAL | COUPON % | MATURITY DATE |
| Bankers Investment Trust | 15,000,000 | 8 | 31/10/2023 |
| abrdn New Dawn Investment Trust | 19,996,625 | 2.626 | 14/12/2023 |
| Murray International Trust | 29,991,000 | 2.25 | 16/05/2024 |
| Baillie Gifford Japan Trust | 50,412,515 | 1.585 | 24/11/2024 |
| Baillie Gifford Shin Nippon | 11,383,471 | 1.693 | 18/12/2024 |
| Templeton Emerging Markets | 100,000,000 | 2.089 | 31/01/2025 |
| Majedie Investments | 20,647,560 | 7.25 | 31/03/2025 |
| TR Property Investment Trust | 42,826,552 | 1.92 | 10/02/2026 |
| Scottish Mortgage Investment Trust | 142,051,059 | 2.601 | 09/04/2026 |
| Scottish Mortgage Investment Trust | 236,751,766 | 2.234 | 29/06/2026 |
| Scottish Mortgage Investment Trust | 50,000,000 | 12 | 30/06/2026 |
Source: AIC, Kepler Partners, as at 29/09/2023.
Kepler Partners is a third-party supplier and not part of interactive investor. Neither Kepler Partners or interactive investor will be responsible for any losses that may be incurred as a result of a trading idea.
These articles are provided for information purposes only. Occasionally, an opinion about whether to buy or sell a specific investment may be provided by third parties. The content is not intended to be a personal recommendation to buy or sell any financial instrument or product, or to adopt any investment strategy as it is not provided based on an assessment of your investing knowledge and experience, your financial situation or your investment objectives. The value of your investments, and the income derived from them, may go down as well as up. You may not get back all the money that you invest. The investments referred to in this article may not be suitable for all investors, and if in doubt, an investor should seek advice from a qualified investment adviser.
Full performance can be found on the company or index summary page on the interactive investor website. Simply click on the company's or index name highlighted in the article.
Important Information
Kepler Partners is not authorised to make recommendations to Retail Clients. This report is based on factual information only, and is solely for information purposes only and any views contained in it must not be construed as investment or tax advice or a recommendation to buy, sell or take any action in relation to any investment.
This report has been issued by Kepler Partners LLP solely for information purposes only and the views contained in it must not be construed as investment or tax advice or a recommendation to buy, sell or take any action in relation to any investment. If you are unclear about any of the information on this website or its suitability for you, please contact your financial or tax adviser, or an independent financial or tax adviser before making any investment or financial decisions.
The information provided on this website is not intended for distribution to, or use by, any person or entity in any jurisdiction or country where such distribution or use would be contrary to law or regulation or which would subject Kepler Partners LLP to any registration requirement within such jurisdiction or country. Persons who access this information are required to inform themselves and to comply with any such restrictions. In particular, this website is exclusively for non-US Persons. The information in this website is not for distribution to and does not constitute an offer to sell or the solicitation of any offer to buy any securities in the United States of America to or for the benefit of US Persons.
This is a marketing document, should be considered non-independent research and is subject to the rules in COBS 12.3 relating to such research. It has not been prepared in accordance with legal requirements designed to promote the independence of investment research.
No representation or warranty, express or implied, is given by any person as to the accuracy or completeness of the information and no responsibility or liability is accepted for the accuracy or sufficiency of any of the information, for any errors, omissions or misstatements, negligent or otherwise. Any views and opinions, whilst given in good faith, are subject to change without notice.
This is not an official confirmation of terms and is not to be taken as advice to take any action in relation to any investment mentioned herein. Any prices or quotations contained herein are indicative only.
Kepler Partners LLP (including its partners, employees and representatives) or a connected person may have positions in or options on the securities detailed in this report, and may buy, sell or offer to purchase or sell such securities from time to time, but will at all times be subject to restrictions imposed by the firm's internal rules. A copy of the firm's conflict of interest policy is available on request.
Past performance is not necessarily a guide to the future. The value of investments can fall as well as rise and you may get back less than you invested when you decide to sell your investments. It is strongly recommended that Independent financial advice should be taken before entering into any financial transaction.
PLEASE SEE ALSO OUR TERMS AND CONDITIONS
Kepler Partners LLP is a limited liability partnership registered in England and Wales at 9/10 Savile Row, London W1S 3PF with registered number OC334771.
Kepler Partners LLP is authorised and regulated by the Financial Conduct Authority.