How the Nasdaq can really add another 1,000 points
1st October 2018 09:00
by Alistair Strang from Trends and Targets
As the US tech-heavy index continues to surge, technical analyst Alistair Strang's numbers suggest the bull run could have much further to run, unless this happens.

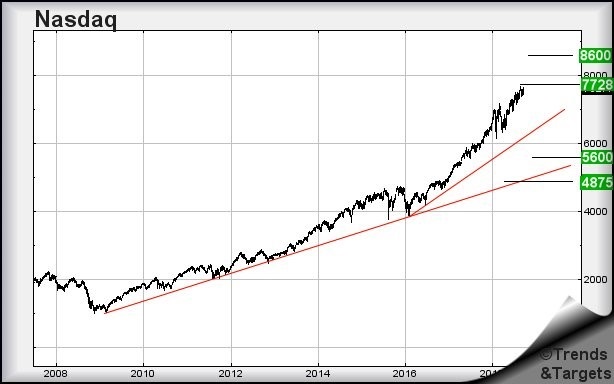
Nasdaq Big Picture (Nasdaqi:NDX)
The US Index has achieved a major high during the last month, creating the situation where it's reasonable to ask "How High can the Nasdaq go?"
Obviously, a lot depends on China and their response to tariffs. But we were showing 7,499 as a pretty major point of interest and the Nasdaq has successfully touched the trend, bettered the trend, retreated below the trend, then exceeded it again.
All these dance steps tend indicate we were indeed scanning the correct series of numbers, suggesting the index now need only close above 7,692 to enter a further phase upward with an initial target at 7,728 points.
At this point, things get a bit weird as we've clear air up to 8,600 points. By clear air, we refer to something some shares exhibit, the potential of sharp upward movement, usually generated when a company releases some positive news. In the case of the Nasdaq, we certainly have difficulty inventing an excuse for turbulence between 7,728 and 8,600 points.
For the index to provide concern, it presently requires break the uptrend since the start of 2016. At time of writing, this implies the market requires below 6,052 to justify investing in running shoes as reversal to an initial 5,600 makes sense.
If broken, secondary at 4,875 makes less sense as it trashes the uptrend since 2009, risking opening the floodgates for serious reversals.
For now, if it were a share, the answer to "How high is the Nasdaq?" appears to be 8,600 points.
Source: Trends and Targets Past performance is not a guide to future performance
Alistair Strang has led high-profile and "top secret" software projects since the late 1970s and won the original John Logie Baird Award for inventors and innovators. After the financial crash, he wanted to know "how it worked" with a view to mimicking existing trading formulas and predicting what was coming next. His results speak for themselves as he continually refines the methodology.
Alistair Strang is a freelance contributor and not a direct employee of Interactive Investor. All correspondence is with Alistair Strang, who for these purposes is deemed a third-party supplier. Buying, selling and investing in shares is not without risk. Market and company movement will affect your performance and you may get back less than you invest. Neither Alistair Strang or Interactive Investor will be responsible for any losses that may be incurred as a result of following a trading idea.
These articles are provided for information purposes only. Occasionally, an opinion about whether to buy or sell a specific investment may be provided by third parties. The content is not intended to be a personal recommendation to buy or sell any financial instrument or product, or to adopt any investment strategy as it is not provided based on an assessment of your investing knowledge and experience, your financial situation or your investment objectives. The value of your investments, and the income derived from them, may go down as well as up. You may not get back all the money that you invest. The investments referred to in this article may not be suitable for all investors, and if in doubt, an investor should seek advice from a qualified investment adviser.
Full performance can be found on the company or index summary page on the interactive investor website. Simply click on the company's or index name highlighted in the article.