India vs China: how trust managers are allocating
Given the two markets have had very different years, a Kepler analyst examines how a swathe of investment trusts are reacting.
3rd October 2025 14:00
This content is provided by Kepler Trust Intelligence, an investment trust focused website for private and professional investors. Kepler Trust Intelligence is a third-party supplier and not part of interactive investor. It is provided for information only and does not constitute a personal recommendation.
Material produced by Kepler Trust Intelligence should be considered a marketing communication, and is not independent research.
While the local supermarket’s roll-out of chocolate reindeer, and Instagram’s aggressive marketing of advent calendars would disagree with this notion, it seems far too soon in the year to be undertaking an annual review.
However, taking a check of the past 12 months (before Michael Bublé comes out of cold storage) has unveiled a very interesting performance statistic.
Over the past year, (to 24 September 2025) Asian markets, as determined by MSCI AC Asia ex Japan, have outperformed the mighty S&P 500, returning 21% to 15% despite the seeming deluge of negative headlines, primarily around tariffs. Even more surprisingly, this outperformance has been predominantly driven by the resurgence of China, the main antagonist of the tariff rhetoric. Perhaps even more surprisingly still, this has been achieved despite the lacklustre performance of India, previously the region’s star performer.
Winding back to mid-September 2024, India was at the top of its game. The MSCI India Index was up nearly 90% over five years, the small and mid-cap market was on a tear, and the economy was one of the fastest growing in the world. Meanwhile, China was suffering from a consumer confidence crisis and fearing a deeper economic stall, weighed down by a property collapse, regulatory headwinds, and weak export demand.
However, over the following few weeks, a series of announcements from each country saw their near-term fortunes reverse, leading many investors to revisit their investment case for each.
In this article, we recap what has caused the divergence in the two countries’ performance over the past year, what impact this has had on allocations, and whether investment trust managers have changed their own allocations in response to this.
India’s bumps in the road
India’s multi-year bull run leading up to September 2024 reflected the numerous structural positives such as a young and dynamic workforce, reform-focussed government, and a growing role as a global manufacturing hub. This led to strong returns from the market, best demonstrated by the MSCI India Index, which rose circa 89% in the five years to its peak on 26 September 2024.
However, from this point onwards, the market underwent a pullback. A combination of some companies missing, admittedly lofty, earnings expectations, central bank interventions to curb the excesses in the small-cap market, and government policy missteps saw the heat come out of the Indian market, leading to a circa five-month downmarket. The index fell just over 17% to its nadir in mid-March 2025, narrowly missing out on being a technical bear market.
Whilst India briefly enjoyed a relief rally as concerns eased, this was soon interrupted by the ‘Liberation Day’ turmoil in early April as India, along with many emerging and developed markets alike, was hit by a broad sell-off. This performance is shown in the chart below, using an ETF as a proxy for the Indian market. The ETF takes into account the impact of CGT-accruals and is therefore more representative of what return passive investors would achieve.
INDIA’S ONE-YEAR PERFORMANCE
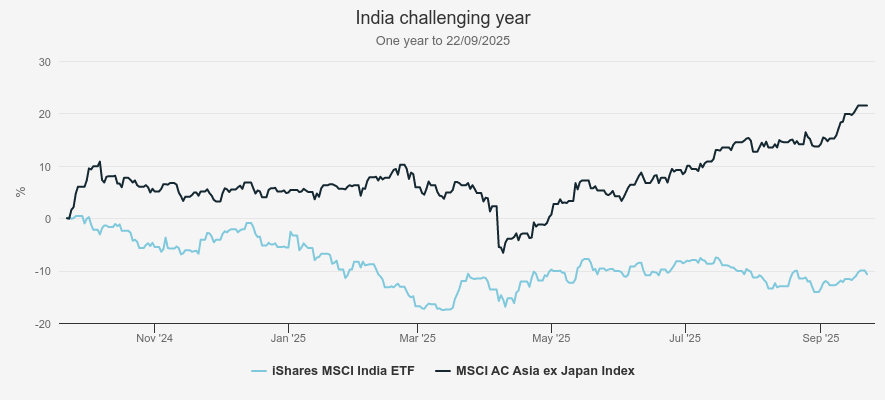
Source: Morningstar. Past performance is not a reliable indicator of future results
To address the missteps that led to the initial pullback, Indian authorities announced a series of changes. The central bank announced a surprise 50bps rate cut in June, following on from two 25bps cuts earlier in 2025 — the first rate cuts in nearly five years. Also in June, the government announced changes to cash reserve rules to improve liquidity, with further announcements in August 2025 of upcoming income tax cuts in April 2026, in order to stimulate consumer spending.
Whilst these have contributed to a modest recovery from the nadir earlier in 2025, the market remains in negative territory since the peak a year ago, with the MSCI India Index having fallen by 10.7% in the past year (to 22 September 2025).
Bull in a China shop
China’s stock market performance has, rather coincidentally, been almost a mirror of that of India. The country had been through a challenging period in the years leading up to September 2024 as a result of factors such as the ill-fated ‘zero-Covid’ policy, the bursting of the housing bubble, and in turn, the collapse in consumer sentiment. This led to concerns over low spending, slowing economic growth, and hence, weak stock markets.
Beginning in September 2024, though, the Chinese government came out with a raft of stimulus measures designed to address the country’s key weaknesses. This included policies to stabilise the property market and encourage banks to begin lending again, both designed to shore up consumer confidence, with further measures announced to improve shareholder returns on banks to try and stimulate stock markets also.
This caused a sharp rally in the Chinese market as speculation mounted over even more announcements, although the loftier of these expectations failed to materialise. However, in early 2025, Chinese firm DeepSeek announced an AI model that rivalled global leaders such as ChatGPT despite claiming it was built for a fraction of the cost. This caused a resurgence in sentiment, particularly in the tech sector, driving markets up again.
CHINA’S YEAR OF RECOVERY
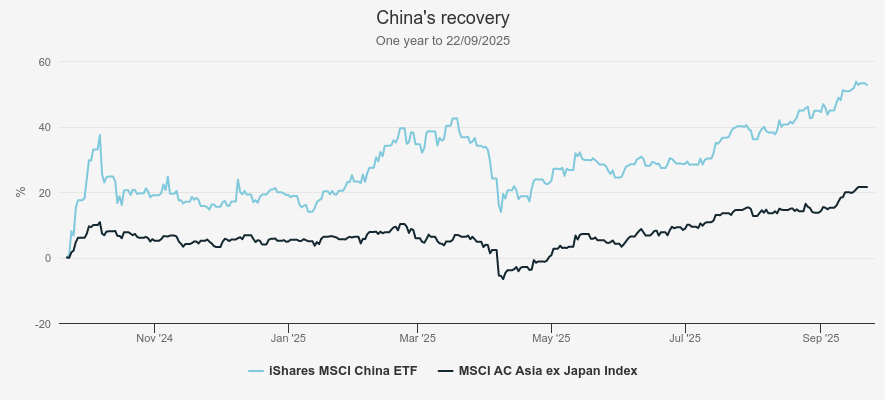
Source: Morningstar. Past performance is not a reliable indicator of future results
As with India, China was also hit by the tariff-induced Liberation Day sell-off in April. This, however, proved just to be a temporary pullback, with the market since returning to positive territory, led primarily by the tech sector again, as optimism grew over China’s developments in the AI space and investors looked through the impact of tariffs.
As a result, the Chinese market has delivered exceptional absolute performance since last September, returning 49.3% in the 12 months to 22 September 2025, considerably outperforming neighbouring India in this time period. As this shows, the contrasting years of these two markets have had a pull in each direction on the overall performance of the region, with the MSCI AC Asia ex Japan Index, of which both countries are sizeable constituents, returning 21.5% over the period, ahead even of the 15% return of the usually all-conquering S&P.
At this point, it is worth putting the near-term performance of both India and China into context. Over the past five years, the Indian index has delivered a 77% return, despite the near-term challenges, whereas the MSCI China Index has delivered a return of -15.2% even with the near-term rally. Therefore, whilst the performance difference over the last year has been stark, it is debatable as to whether this is merely an element of mean reversion, or a turning point in the long-term outlook for either country.
Allocation changes
One of the best ways to assess the longevity of this performance reversal is to look at how managers have reacted and whether they have changed their allocations. To put these into context, we have first analysed each country’s weighting within the region’s primary index, the MSCI AC Asia ex Japan Index.
Following its years of strong performance, India had climbed to c. 23% of the index by August 2024. At this point, China’s allocation was just 27.5%. This is despite China having peaked at c. 48% in October 2020, when India’s allocation was just 9%, demonstrating the longer-term development. However, much like the performance figures, this trend has reversed in the past year, with China climbing to 33.6% as at the end of August 2025, an increase of 22%, with India falling to 18.3%, a drop of nearly a fifth over the course of the year.
INDIA & CHINA BENCHMARK ALLOCATIONS
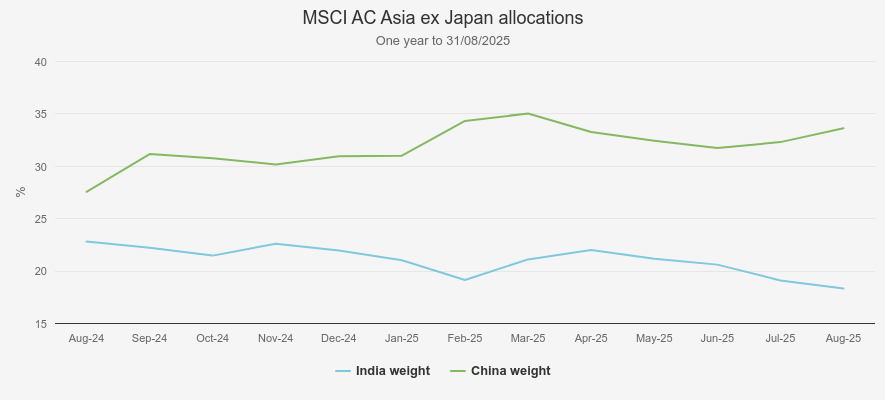
Source: Morningstar
Using this as the backdrop, we next look at how investment trust managers have reacted to the changing outlook. Many managers we have spoken to have noted that they admire the Indian story but have often been hesitant as a result of valuations. However, the recent pullback has lowered this hurdle and opened up opportunities. We have shown the extent of this in the table below, which includes all investment trusts focussed on Asia, and how Indian allocations have changed between August 2024 and August 2025.
INVESTMENT TRUST INDIA ALLOCATIONS
| Trust | Sector | Aug' 24 | Aug' 25 | Percentage point change |
| Aberdeen Asian Income Fund Limited (LSE:AAIF) | Asia Pacific Equity Income | 7.5 | 9.7 | 2.2 |
| Schroder Oriental Income Ord (LSE:SOI) | Asia Pacific Equity Income | 0 | 2.1 | 2.1 |
| Schroder Asian Total Return Inv. Company (LSE:ATR) | Asia Pacific | 11.1 | 12.6 | 1.5 |
| Invesco Asia Dragon Trust Ord (LSE:IAD) | Asia Pacific Equity Income | 11.7 | 10.4 | -1.3 |
| Scottish Oriental Smaller Cos Ord (LSE:SST) | Asia Pacific Smaller Companies | 38 | 34.7 | -3.3 |
| Schroder AsiaPacific Ord (LSE:SDP) | Asia Pacific | 17.4 | 13.3 | -4.1 |
| JPMorgan Asia Growth & Income Ord (LSE:JAGI) | Asia Pacific Equity Income | 20.5 | 16.2 | -4.3 |
| Fidelity Asian Values Ord (LSE:FAS) | Asia Pacific Smaller Companies | 14.3 | 9.3 | -5 |
| abrdn Asia Focus plc (LSE:AAS) | Asia Pacific Smaller Companies | 29.4 | 23.9 | -5.5 |
| Henderson Far East Income Ord (LSE:HFEL) | Asia Pacific Equity Income | 12.9 | 4.2 | -8.7 |
| Pacific Horizon Ord (LSE:PHI) | Asia Pacific | 23 | 13 | -10 |
| Pacific Assets Ord (LSE:PAC) | Asia Pacific | 43.3 | 31.5 | -11.8 |
| Overall Average | 19.1 | 15.1 | -4 | |
Source: AIC, Kepler calculations, as at 31/08/2025. NB: During the period, Invesco Asia (IAT) merged with Asia Dragon (DGN) to become Invesco Asia Dragon (IAD). The allocations of IAT and IAD are used in the above table.
One standout from this table is Schroder Oriental Income Ord (LSE:SOI), with manager Richard Sennitt initiating a position in the country through Power Grid of India. SOI owns a relatively concentrated portfolio of predominantly large-cap Asian equities, designed to generate an attractive and growing income over the long term. The trust is benchmarked to the MSCI AC Pacific ex Japan Index, which, crucially, does not include India due to the country’s growth bias and low-income characteristics — the MSCI India Index yields just 1.2%. As such, Richard’s allocation is an off-benchmark and active bet, which he notes is directly as a result of the country’s sell-off making valuations more attractive. Power Grid yields just over 3% as at the time of writing. This is a key example of India’s fall, putting the country on the radar of many managers, offering both capital growth and income potential, in keeping with Richard’s approach, despite it not even being in his investment universe. SOI has captured a lot of the market performance in the past few months, delivering good absolute NAV returns of over 17% year-to-date (to 25/09/2025). Despite this, the trust’s discount has remained stable, at around 5% throughout. Whilst still one of the narrowest in the peer group, this arguably doesn’t reflect the region’s improving outlook, and could add to the appeal for investors.
Another trust with an increased India allocation is Aberdeen Asian Income Fund Limited (LSE:AAIF). Managers Isaac Thong and Eric Chan have increased their allocation by 2.2 percentage points, or nearly 30%, despite also having an income mandate, although this period coincides with the trust adopting an enhanced dividend policy at the beginning of 2025. This means that income will be paid from a combination of revenue generated and a contribution from capital if required, and so the demands on the portfolio to provide income are lower, although the managers do have a portion of the portfolio they reallocate in order to capitalise on short-term opportunities, so-called dividend enhancement trades, meaning allocations can vary on a month-to-month basis. This announcement appears to have a positive impact on the trust’s discount, which currently stands at c. 9%, slightly narrower than the c. 12% a year prior. Despite this, the trust has close to one of the widest discounts in the Asia Pacific Equity Income peer group. Furthermore, this change in approach means the managers have more flexibility in where they can invest as they are not limited to just focussing on higher-yielding stocks, and can consider those with better total return prospects. Regardless, they have clearly identified good value opportunities in India that they believe can generate consistent income and capital growth, in line with AAIF’s new objective.
The third trust increasing its India weight was Schroder Asian Total Return Inv. Company (LSE:ATR). Managers Robin Parbrook and King Fuei Lee have long exercised valuation discipline when it came to India, acknowledging there were many high-quality companies that their bottom-up process had identified, although they were conscious not to overpay for them. However, with valuations having come down over the year following the sell-off, this may have encouraged the managers to add to the country. However, in our recent results analysis, we highlighted the short position the managers had on the wider Indian market, which may help balance off the risk of higher valuations with a number of bottom-up opportunities.
Considering the data as a whole, it shows us that overall, managers have otherwise seen an (unweighted) average fall in their India allocations from 19.1% to 15.1%, or around a 21% reduction. This drop is similar in scale to how India has fallen as a percentage of the Asia Index, dropping from 22% to 18.3%; however, it is notably larger than the c. 11% fall of the Indian market. As such, it could be interpreted that managers have reduced their Indian allocations as the market has fallen, despite commentary suggesting the opportunity set has increased.
This assumption, of course, comes with many caveats. Whilst it could indicate managers have sold India, it could also be that other countries have increased, and therefore diluted the India exposure as a result. The fall in the Indian market has not happened in isolation, and therefore, other countries rallying may have mathematically caused a drop in Indian allocations, without active decisions from the managers. This outcome is very plausible when considering the strength of the Chinese market, which also makes up sizeable allocations in portfolios.
To help put this into context, we can consider changes made in managers’ China allocations, which we have shown in the table below.
INVESTMENT TRUST CHINA ALLOCATIONS
| Trust | Sector | Aug' 24 | Aug' 25 | Percentage point change |
| Aberdeen Asian Income Fund Limited (LSE:AAIF) | Asia Pacific Equity Income | 3.4 | 17.5 | 14.1 |
| Pacific Horizon Ord (LSE:PHI) | Asia Pacific | 25 | 37 | 12 |
| Pacific Assets Ord (LSE:PAC) | Asia Pacific | 7 | 16.4 | 9.4 |
| Fidelity Asian Values Ord (LSE:FAS) | Asia Pacific Smaller Companies | 19.6 | 28.4 | 8.9 |
| Henderson Far East Income Ord (LSE:HFEL) | Asia Pacific Equity Income | 15.1 | 22.7 | 7.6 |
| abrdn Asia Focus plc (LSE:AAS) | Asia Pacific Smaller Companies | 9.8 | 16.4 | 6.5 |
| Scottish Oriental Smaller Cos Ord (LSE:SST) | Asia Pacific Smaller Companies | 18 | 22.8 | 4.8 |
| Schroder Oriental Income Ord (LSE:SOI) | Asia Pacific Equity Income | 8.1 | 11.8 | 3.7 |
| Invesco Asia Dragon Trust Ord (LSE:IAD) | Asia Pacific Equity Income | 25.2 | 28.4 | 3.2 |
| Schroder Asian Total Return Inv. Company (LSE:ATR) | Asia Pacific | 0.5 | 2.9 | 2.4 |
| Schroder AsiaPacific Ord (LSE:SDP) | Asia Pacific | 4.6 | 6 | 1.4 |
| JPMorgan Asia Growth & Income Ord (LSE:JAGI) | Asia Pacific Equity Income | 29.1 | 29.9 | 0.8 |
| Overall Average | 13.8 | 20 | 6.2 | |
Source: AIC, Kepler calculations, as at 31/08/2025
Much like with performance, the China allocations provide a very different picture to India. The average investment trust has increased its allocation to China significantly, from c. 14% to 20% on average, or around a 45% increase. The data here is even more conclusive, with every trust having a higher allocation to China at the end of the period than at the beginning. The increase in portfolio weights, though, is less than the move in the market, which rose 49%, meaning that market movements likely explain a large portion of the increase, although it is unlikely to be the sole factor.
The trust seeing the largest increase in allocations is again AAIF, rising from 3.4% to 17.5%. As with the change in the Indian allocation, we would point to the change in strategy as a likely contributing factor. That being said, we understand that the managers have recently added to the country to capitalise on the improving dividend picture, as a result of government initiatives to increase shareholder returns, similar to the programmes seen in Japan and Korea in recent years, although, as noted, country allocations can vary in the short-term.
Pacific Assets Ord (LSE:PAC) has also had a sizeable increase in its China allocation, which interestingly, contrasts with it having the biggest drop in its Indian allocation. Manager Doug Ledingham has had a long-standing overweight to India as his quality-focussed process has identified many industry-leading firms, run by entrepreneurial management teams with a consideration of minority shareholders. The volatility in the past year has provided Doug with many opportunities. In China, he has added to online travel booking company Trip.com. He notes that the firm has sought to compete on service rather than just price, demonstrating its quality characteristics, as well as being well placed to capture the growing wealth of the region. This is just one example of incremental additions to China, which has come about as the manager has found several high-quality companies with aligned management teams that have enabled him to narrow the portfolio’s underweight. That being said, Doug has also added two new positions in India, as we discussed in our recent portfolio update. This is another useful demonstration that, whilst the aggregate numbers may not reflect it, some managers are finding opportunities in the pullback of the Indian market.
This pullback has had a short-term impact on PAC’s NAV performance, although longer-term numbers remain robust. However, it has had an even bigger impact on the discount. In early 2024, prior to India’s sell-off, PAC traded close to NAV, but the discount has since widened significantly, currently trading around 11%. This is wider than the c. 9% five-year average, and wider than the peer group average. As such, it arguably reflects short-term investor sentiment, rather than the trust’s long-term potential.
Pacific Horizon Ord (LSE:PHI) has also seen significant increases in the China allocations in the past year. In the most recent financial results (to 31/07/2025), managers Roderick Snell and Ben Durrant noted significant additions in light of the changing backdrop, primarily focussing on firms with industry-leading positions and opportunities for growth. Examples of new holdings include Kanzhun, an online recruitment firm, as well as more established firms such as online food delivery firm Meituan. Furthermore, the managers topped up positions in Tencent Holdings and Pinduoduo.
ATR’s increase from 0.5% to 2.9% is interesting. It is more than a 400% increase, though in reality, it is likely just the addition of one holding in a concentrated portfolio. In the annual report (to 31/12/2024), the managers added Chinese battery firm CATL in the year, which was a 1.6% position at the point of the interim statement on 30/06/2025.
Whilst this data does show a broad increase in China allocations, many are still underweight compared to the broader index. As such, whilst the market has likely contributed some of the increased allocations, this may also be a result of managers narrowing their underweights to reduce the risk of being so underweight should the market rally again on further stimulus measures. Notably, PAC and PHI are renowned for having long-term investment horizons, therefore indicating this repositioning is a reflection of their managers’ changing view on the outlook, rather than just mean reversion.
One factor affecting the China narrative is Hong Kong. As discussed in a previous article, many managers use Hong Kong as a proxy for China, which offers similar exposure whilst avoiding some of China’s governance risks. As this article focusses on the impact of mainland regulation changes affecting the outlook, we have kept the scope on direct China allocations. However, it may be the case that managers have added to Hong Kong either in exchange for, or alongside their China additions, in order to capture a China recovery. Average Hong Kong allocations have also broadly increased in the period, albeit at just c. 2 percentage points, equivalent to just shy of 30%.
The tariff conundrum
Taking these changes at face value, it appears that managers have broadly become more positive on the prospects for China, hence increasing their allocations, and waned on India, although, as we have demonstrated with a couple of examples, they are still finding opportunities in the latter. Whilst these changes may seem somewhat counterintuitive in buying a rising market and selling a falling one, there is potentially one other factor that affects outlooks for both — tariffs.
As mentioned, both markets sold off in April 2025 following President Trump’s Liberation Day tariff announcements. Whilst these have since been scaled back in many cases, the outlooks for India and China have changed. Unlike many, China tackled the tariff issue head-on, retaliating and escalating in the months since. Things have calmed down since their peak, but the situation remains fluid. The overarching theme, though, is that the Chinese government seem to be looking through the current challenges, and is willing to support the economy despite the external pressure, which may have increased the appeal for investment trust managers, on the hopes of further domestic stimulus to tackle this.
India took a more conciliatory approach. Ahead of Liberation Day, India changed import tariffs on US goods and indicated it was willing to import more. Despite this, the country was still hit with a 25% tariff, which was then escalated to 50% as a result of the country’s purchase of heavily sanctioned Russian oil. As such, the country is now facing a challenging balancing act, either having to face a high tariff rate or higher energy costs. With the country seemingly in a different stage of its tariff regime, investors may have reduced their allocations for fear of the consequences.
Conclusion
The swings in performance of both India and China over the past year have been a reminder that long-held market narratives can quickly change. The rally in China and pullback in India have coincided, whilst also bucking the trend of India’s years of outperformance over its peers. Many managers were overweight India and underweight China ahead of this change and may have been caught out by the changes. China underweights have been narrowed in the past year, which may have been done to lessen the future risk of such swings, although, considering the trusts with the largest increases in their China allocations are those with long-term investment horizons, it is arguable that they believe this trade has further to go.
One additional factor though, is tariffs. Both countries are in different stages of negotiation with the US, with China having seemingly found success in facing them down, whilst India is in an escalatory phase. Therefore, this could be another reason behind the allocation changes, responding to the changing outlook for both as a result of the policy announcements and tariff situation. Either way, it highlights the challenges of investing in such a broad region with diverse drivers, albeit one that can be highly rewarding with exceptional companies and strong growth potential.
For investors, though, investment trusts may well be an ideal way of playing this situation due to their discounts. These are still prevalent across the region and have only narrowed slightly in aggregate, from 9.3% at 31/08/2024 to 8.3% a year later. On a more granular level, the opportunity set is even stronger, as we have highlighted with the likes of PAC. The relative lack of change in discount levels is despite the region’s strong performance over the past year, and significant changes to the outlook. As such, discounts could not only provide a ‘margin of safety’ against further volatility, but also potentially enhance returns as investors begin to recognise the improving sentiment in the region. With under 90 days to go, discounts could be the early Christmas present for investors.
Kepler Partners is a third-party supplier and not part of interactive investor. Neither Kepler Partners or interactive investor will be responsible for any losses that may be incurred as a result of a trading idea.
These articles are provided for information purposes only. Occasionally, an opinion about whether to buy or sell a specific investment may be provided by third parties. The content is not intended to be a personal recommendation to buy or sell any financial instrument or product, or to adopt any investment strategy as it is not provided based on an assessment of your investing knowledge and experience, your financial situation or your investment objectives. The value of your investments, and the income derived from them, may go down as well as up. You may not get back all the money that you invest. The investments referred to in this article may not be suitable for all investors, and if in doubt, an investor should seek advice from a qualified investment adviser.
Full performance can be found on the company or index summary page on the interactive investor website. Simply click on the company's or index name highlighted in the article.
Important Information
Kepler Partners is not authorised to make recommendations to Retail Clients. This report is based on factual information only, and is solely for information purposes only and any views contained in it must not be construed as investment or tax advice or a recommendation to buy, sell or take any action in relation to any investment.
This report has been issued by Kepler Partners LLP solely for information purposes only and the views contained in it must not be construed as investment or tax advice or a recommendation to buy, sell or take any action in relation to any investment. If you are unclear about any of the information on this website or its suitability for you, please contact your financial or tax adviser, or an independent financial or tax adviser before making any investment or financial decisions.
The information provided on this website is not intended for distribution to, or use by, any person or entity in any jurisdiction or country where such distribution or use would be contrary to law or regulation or which would subject Kepler Partners LLP to any registration requirement within such jurisdiction or country. Persons who access this information are required to inform themselves and to comply with any such restrictions. In particular, this website is exclusively for non-US Persons. The information in this website is not for distribution to and does not constitute an offer to sell or the solicitation of any offer to buy any securities in the United States of America to or for the benefit of US Persons.
This is a marketing document, should be considered non-independent research and is subject to the rules in COBS 12.3 relating to such research. It has not been prepared in accordance with legal requirements designed to promote the independence of investment research.
No representation or warranty, express or implied, is given by any person as to the accuracy or completeness of the information and no responsibility or liability is accepted for the accuracy or sufficiency of any of the information, for any errors, omissions or misstatements, negligent or otherwise. Any views and opinions, whilst given in good faith, are subject to change without notice.
This is not an official confirmation of terms and is not to be taken as advice to take any action in relation to any investment mentioned herein. Any prices or quotations contained herein are indicative only.
Kepler Partners LLP (including its partners, employees and representatives) or a connected person may have positions in or options on the securities detailed in this report, and may buy, sell or offer to purchase or sell such securities from time to time, but will at all times be subject to restrictions imposed by the firm's internal rules. A copy of the firm's conflict of interest policy is available on request.
Past performance is not necessarily a guide to the future. The value of investments can fall as well as rise and you may get back less than you invested when you decide to sell your investments. It is strongly recommended that Independent financial advice should be taken before entering into any financial transaction.
PLEASE SEE ALSO OUR TERMS AND CONDITIONS
Kepler Partners LLP is a limited liability partnership registered in England and Wales at 9/10 Savile Row, London W1S 3PF with registered number OC334771.
Kepler Partners LLP is authorised and regulated by the Financial Conduct Authority.