This isn’t just a chart signal, it’s an M&S chart signal
Independent analyst Alistair Strang considers the prospect of the FTSE 100 retailer enjoying an upwards surge.
18th September 2025 09:06
by Alistair Strang from Trends and Targets
There’s a chart signal that’s generally more reliable than a weather forecast and currently Marks & Spencer Group (LSE:MKS) are displaying it quite explicitly.
- Invest with ii: Top UK Shares | Share Tips & Ideas | Open a Trading Account
In fact, we could even say that “this isn’t just a chart signal, it’s an M&S chart signal” with a reasonable hope that our projected outcome will prove to be correct.
Of course, there’s always a fly and always some ointment, but visually this one looks pretty amazing.
The chart extract below shows a green line representing the price level above which we require the share to close, potentially presenting a scenario where some real price growth can be anticipated.
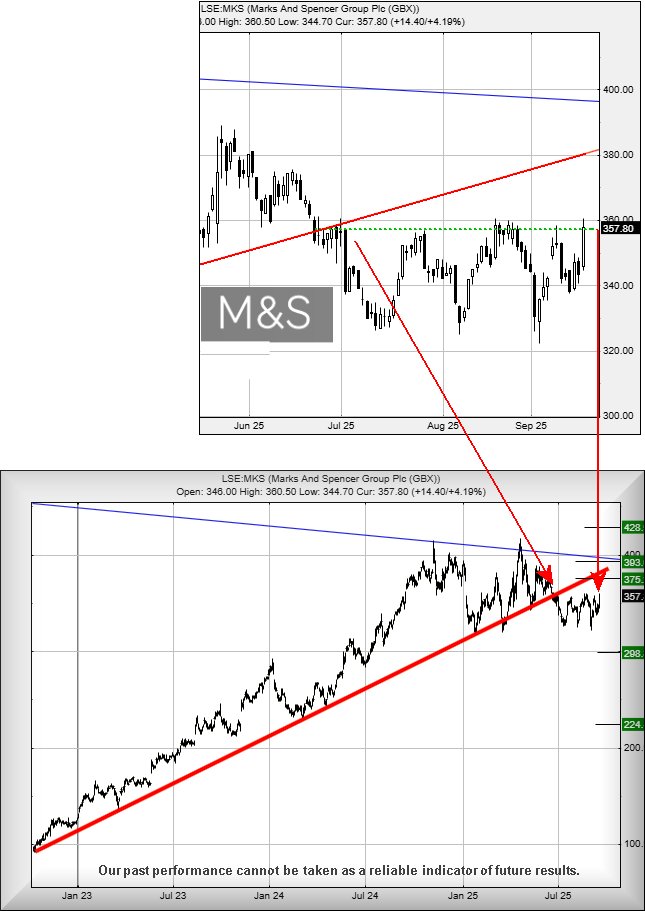
Source: Trends and Targets. Past performance is not a guide to future performance.
Essentially, in a textbook example of our thoughts, share price closure above 360p should make movement to an initial 375p almost certain. Our secondary, if exceeded, calculates at a future 393p. This sort of near-10% price recovery would emplace the share price on a path to a long-term 428p.
But of course, this is the stock market and it’s rare for something as obvious as this to appear. Thus, we should suspect that a trap for traders is looming, aside from the absurd (but real) detail of “that’s what they’d want us to think!”
To be blunt, we do anticipate M&S enjoying an upwards surge and given share price movements since July, it looks pretty confident.
The share price needs to close below 330p before the need to buy “these are not just any running shoes, these are M&S running shoes...”
Alistair Strang has led high-profile and "top secret" software projects since the late 1970s and won the original John Logie Baird Award for inventors and innovators. After the financial crash, he wanted to know "how it worked" with a view to mimicking existing trading formulas and predicting what was coming next. His results speak for themselves as he continually refines the methodology.
Alistair Strang is a freelance contributor and not a direct employee of Interactive Investor. All correspondence is with Alistair Strang, who for these purposes is deemed a third-party supplier. Buying, selling and investing in shares is not without risk. Market and company movement will affect your performance and you may get back less than you invest. Neither Alistair Strang or Interactive Investor will be responsible for any losses that may be incurred as a result of following a trading idea.
These articles are provided for information purposes only. Occasionally, an opinion about whether to buy or sell a specific investment may be provided by third parties. The content is not intended to be a personal recommendation to buy or sell any financial instrument or product, or to adopt any investment strategy as it is not provided based on an assessment of your investing knowledge and experience, your financial situation or your investment objectives. The value of your investments, and the income derived from them, may go down as well as up. You may not get back all the money that you invest. The investments referred to in this article may not be suitable for all investors, and if in doubt, an investor should seek advice from a qualified investment adviser.
Full performance can be found on the company or index summary page on the interactive investor website. Simply click on the company's or index name highlighted in the article.