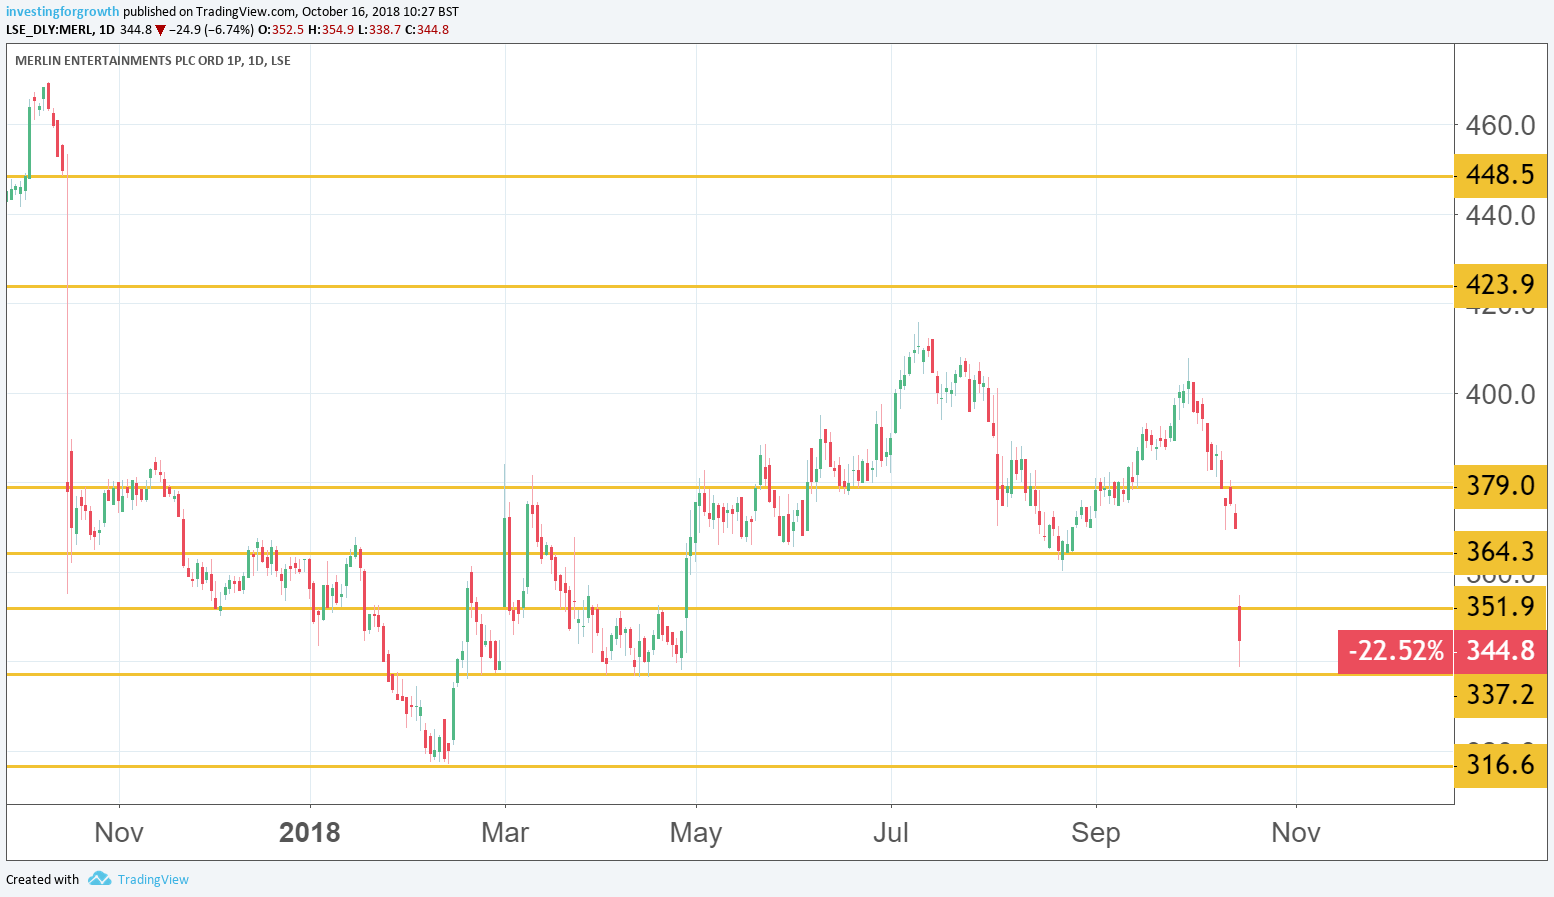
Merlin Entertainments dives again
16th October 2018 11:00
by Richard Hunter from interactive investor
After plunging again to a six-month low, Richard Hunter, head of markets at interactive investor, talks us through prospects for the rollercoasters and waxworks business.

While Merlin Entertainments is not yet providing the magic, at least this update reflects largely positive demand for its various theme parks and attractions.
The terrorist attacks in London and poor weather which led to a profit warning a year ago have thankfully not been duplicated. Even so, a return to normality in visitors to London is a long time coming, while Merlin’s strategy to build up other parts of the operation to provide diversification comes at an inevitable cost, with net debt at £1.2 billion, as mentioned at the half-year numbers in August.
Meanwhile, the dividend yield is certainly not an attraction, coming in at just 2% despite the recent hike, such that investors in the company are purely focused on potential growth.

Source: TradingView (*) Past performance is not a guide to future performance
There are signs that this growth is achievable. Resort Theme Park revenues have spiked 9%, benefiting from product investment and favourable weather, while growth at its Legoland operations continues apace, with revenues up 6.4%.
The decision also to concentrate on providing an experience which includes a short stay at the resorts is also bearing fruit, with Accommodation revenues having risen 28% over the period. Longer term, improving demographics globally could support an upward trend in demand for Merlin's offerings.
Unfortunately, however, for the moment, Merlin remains a “jam tomorrow” stock, and the share price is likely to remain in the doldrums until some prolonged stability is seen.
Today's drop reflects this sentiment and adds to a decline of 18% over the last year, during which time the wider FTSE 250 has lost 7%.
There are some crumbs of comfort, though, with the long-term promise of the business reflected in a market consensus which currently stands at a 'buy'.
*Horizontal lines on charts represent previous technical support and resistance.
These articles are provided for information purposes only. Occasionally, an opinion about whether to buy or sell a specific investment may be provided by third parties. The content is not intended to be a personal recommendation to buy or sell any financial instrument or product, or to adopt any investment strategy as it is not provided based on an assessment of your investing knowledge and experience, your financial situation or your investment objectives. The value of your investments, and the income derived from them, may go down as well as up. You may not get back all the money that you invest. The investments referred to in this article may not be suitable for all investors, and if in doubt, an investor should seek advice from a qualified investment adviser.
Full performance can be found on the company or index summary page on the interactive investor website. Simply click on the company's or index name highlighted in the article.