Oil stock analysis: Amerisur Resources
3rd October 2018 10:23
by Rajan Dhall from interactive investor
Financial markets analyst Rajan Dhall picks out the day's key industry news and runs the numbers to see what this share price might do next.

Both Brent and WTI have been looking bullish of late as the Iran sanctions are on the horizon. This all comes despite inventory levels rising in the US and OPEC stating they will produce more oil to counter any deficit from any sanctions.
Yesterday we had the latest weekly API report from across the pond which showed a build of 0.907 million barrels against the previous reading last week of 2.903 million barrels.
Elsewhere, the Brent - WTI oil spread continues to widen after the aforementioned rise in Cushing stocks. Permian oil is finding it increasingly harder to get to the US Gulf Coast, but the route to Cushing is not as constrained. As a result, this would push inventories higher and widen the WTI Crude discount to Brent Crude.
Amerisur Resources
This morning, Amerisur Resources, the oil producer focused on South America announced the T sand interval at the Pintadillo-1 discovery has flow tested under natural flow at 590 barrels of oil per day (bopd) of 30.4 degrees API oil under choke of 18/64" with strong wellhead pressure of 110psi.
In plain terms, this means they have managed to bring up some oil with better quality than first expected. They are now set to work on the size of the discovery and continue to produce the well.
The company now has a plan to map the T and U sand targets across the area to evaluate the size of the discovery. It will then make a decision to see if the Pintadillo pad will yield more oil for production.
Amerisur chief executive John Wardle said: "This is an exciting and very positive result from Pintadillo-1, ahead of what we had expected. Indeed, at current choked production levels, the well will pay back in under a year.
"The strong natural flow from the well, together with a different oil-water contact indicates a separate structure compared to the T-sand production in the southern part of the block, which further diversifies our production base.'"
Chart analysis
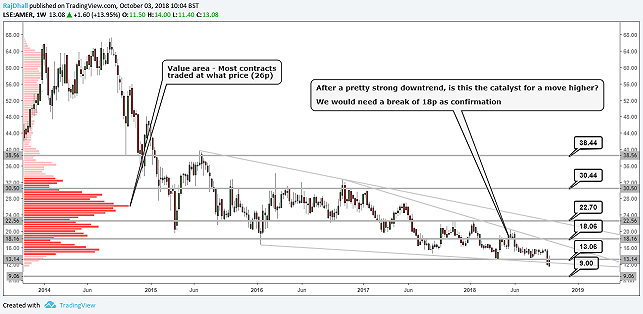
Looking at the weekly price chart it is clear to see that we are still in a technical downtrend, with prices still making lower lows and lower highs.
For this pattern to change, a break of 18p is needed as confirmation, which then opens up 22.7p as a more realistic longer-term target.
The current price where most contracts have been traded is around 26p. This makes it a natural gravitational target further down the road as long as news flow remains positive.
Watch these support and resistance levels - 9p was used as a strong support in October 2011 and 18p historically has been a major level of support and resistance, especially at the beginning of 2016 where a wick was formed on the chart.
Lastly, 13p is significant as it's the previous wave low and, in 2010, the share price consolidated around that mark, so we could see some sticky price action.

Past performance is not a guide to future performance
Rajan Dhall is a freelance contributor and not a direct employee of interactive investor.
These articles are provided for information purposes only. Occasionally, an opinion about whether to buy or sell a specific investment may be provided by third parties. The content is not intended to be a personal recommendation to buy or sell any financial instrument or product, or to adopt any investment strategy as it is not provided based on an assessment of your investing knowledge and experience, your financial situation or your investment objectives. The value of your investments, and the income derived from them, may go down as well as up. You may not get back all the money that you invest. The investments referred to in this article may not be suitable for all investors, and if in doubt, an investor should seek advice from a qualified investment adviser.
Full performance can be found on the company or index summary page on the interactive investor website. Simply click on the company's or index name highlighted in the article.