The outlook for the travel sector and easyJet shares
14th February 2023 09:08
by Alistair Strang from Trends and Targets
Independent analyst Alistair Strang takes a look at the charts for the FTSE 250 airline.
We think there's a disconnect between the travel and leisure index, and the airline industry. The travel sector is doing OK, whereas many components relating to flying appear to be enjoying a struggle, with domestic tourism appearing more popular than international tourism.
- Invest with ii: Share Dealing with ii | Open a Stocks & Shares ISA | Our Investment Accounts
For the travel sector, presently trading around 7,150 points, it looks like it needs exceed 7,790 to trigger recovery to 8,857 points with secondary, if bettered, at 10,754 and a challenge of the pre-Covid level of the market. We are fairly optimistic this should be the case and in a normal environment, would suspect this should bode well for easyJet (LSE:EZJ).
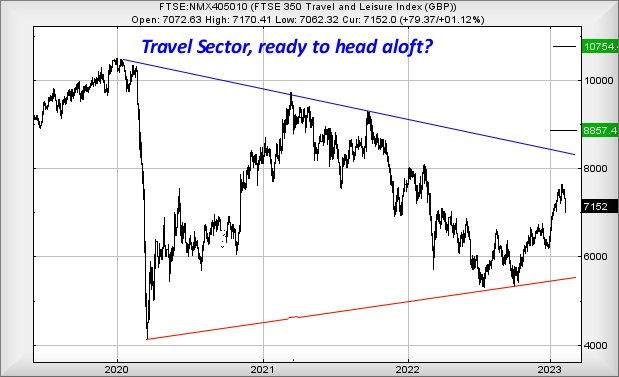
Source: Trends and Targets. Past performance is not a guide to future performance.
However, for easyJet, we are not quite as hopeful as there are major differences between the visuals on the charts.
For instance, easyJet managed to trade lower than the pandemic low, a feature which will suggest difficulty in recovering in the absence of a material change. The little red circles on the easyJet chart catalogue numerous manipulation efforts since 2020, days when the market opted to 'gap down' the share price at the open of trading. As can be seen, Gaps Up became a rarer event, though this year there has been one fairly significant manipulation gap towards the end of January.
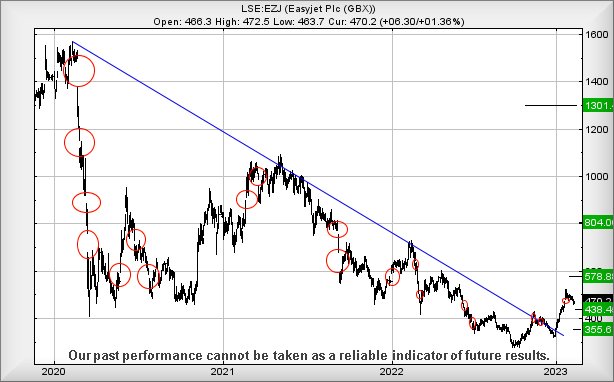
Source: Trends and Targets. Past performance is not a guide to future performance.
From a fairly near-term perspective, easyJet need only exceed 490p as this should allegedly trigger slight recovery to an initial 578p. Our longer-term secondary, should such a level be exceeded, works out at 804p.
The major problem with each of these target levels, aside from not impressing us, is that they fail to do anything other than exceed the immediate blue downtrend since 2020. At present, nothing credible presents itself with the potential of share price movement of substance, challenging the historical pre-Covid high of almost 1,600p.
Instead, despite a FTSE 100 painting higher all-time highs, easyJet currently appears to be struggling to become airborne.
Alistair Strang has led high-profile and "top secret" software projects since the late 1970s and won the original John Logie Baird Award for inventors and innovators. After the financial crash, he wanted to know "how it worked" with a view to mimicking existing trading formulas and predicting what was coming next. His results speak for themselves as he continually refines the methodology.
Alistair Strang is a freelance contributor and not a direct employee of Interactive Investor. All correspondence is with Alistair Strang, who for these purposes is deemed a third-party supplier. Buying, selling and investing in shares is not without risk. Market and company movement will affect your performance and you may get back less than you invest. Neither Alistair Strang or Interactive Investor will be responsible for any losses that may be incurred as a result of following a trading idea.
These articles are provided for information purposes only. Occasionally, an opinion about whether to buy or sell a specific investment may be provided by third parties. The content is not intended to be a personal recommendation to buy or sell any financial instrument or product, or to adopt any investment strategy as it is not provided based on an assessment of your investing knowledge and experience, your financial situation or your investment objectives. The value of your investments, and the income derived from them, may go down as well as up. You may not get back all the money that you invest. The investments referred to in this article may not be suitable for all investors, and if in doubt, an investor should seek advice from a qualified investment adviser.
Full performance can be found on the company or index summary page on the interactive investor website. Simply click on the company's or index name highlighted in the article.