This is the price at which gold should bounce
21st January 2019 08:59
by Alistair Strang from Trends and Targets
Failing to move above the downtrend, gold may have to drop to here before attempting another breakout.

GOLD Updated #Brent #DAX
Today's article is being written from a suspiciously tidy desk. Introducing a fancy new "multiple display screen stand" forced a paper tray to be moved, a tray which included a yellowing & faded article we'd written in 2014 about #Gold.
To our surprise, it remains relevant! And, yes, there was a degree of shaming regarding a desk which had not been cleared for at least five years…
Back in 2014, we speculated on what could happen if gold bettered $1,393. The answer appears to be "nothing" as it has failed achieve such a surprise movement, instead opting to oscillate within a $300 trading range. However, there is something happening at present which certainly justifies slight interest.
Since August 2011, the metal has produced a pretty obvious downtrend, one which has proven impermeable recently with multiple bonks against the blue line on the chart, none of which bettered it.
More often, this sort of nonsense creates a self-completing prophecy with the market suddenly deciding a line to be unbreakable, suddenly introducing reversals due to a plethora of short positions.
In the last couple of days, gold, with eight sessions this year finding the blue line impossible to cross, fell with some predictability.
We've two trigger levels for what we expect to come next. The first one, a fairly obvious visual, demands movement below $1,280 to provoke further weakness down to $1,268 next. If broken, our secondary is currently around $1,259. Our second, preferred, trigger is at $1,275 due to travel below such a point making a drop to the low $1260's almost mandatory.
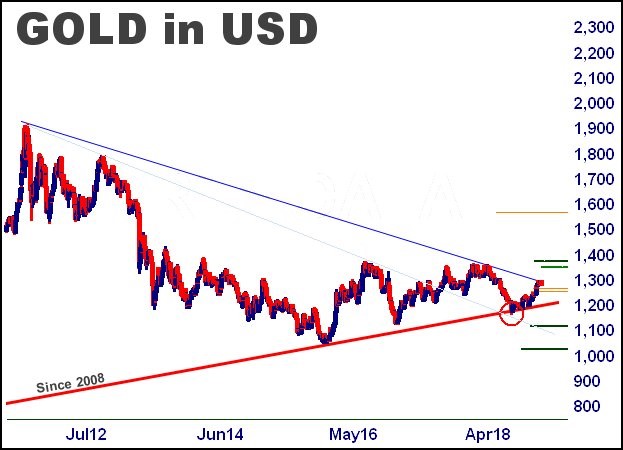
It's probably worth mentioning the Big Picture chart below.
As shown, reversal to the $1,260's isn't really a big deal. We are interested in the close attention the price of the metal paid to the downtrend since 2011, as it strongly promotes an argument where movement now above $1,300 is very liable to bring some sharp increases in the price of the metal.
Alas, we've a slightly converse argument, thanks to the break below the long-term uptrend circled in red on the chart. We get a bit paranoid with this sort of thing, thanks to such a break "proving" an uptrend can break. It creates a situation where any movement now below $1,200 is very liable to justify sustainable short positions, thanks to any breach being capable of producing some strong falls.
For now, we rather suspect gold is indulging in some fakery (though perhaps we're being subtly influenced by Brexit headlines) and some rebound can be anticipated around the $1,260's, one which should prove capable of bettering 'blue' on the chart and attempting a stab at the glass ceiling in the high $1,300's which has existed since 2014.
Source: Trends and Targets Past performance is not a guide to future performance
Alistair Strang has led high-profile and "top secret" software projects since the late 1970s and won the original John Logie Baird Award for inventors and innovators. After the financial crash, he wanted to know "how it worked" with a view to mimicking existing trading formulas and predicting what was coming next. His results speak for themselves as he continually refines the methodology.
Alistair Strang is a freelance contributor and not a direct employee of Interactive Investor. All correspondence is with Alistair Strang, who for these purposes is deemed a third-party supplier. Buying, selling and investing in shares is not without risk. Market and company movement will affect your performance and you may get back less than you invest. Neither Alistair Strang or interactive investor will be responsible for any losses that may be incurred as a result of following a trading idea.
Alistair Strang has led high-profile and "top secret" software projects since the late 1970s and won the original John Logie Baird Award for inventors and innovators. After the financial crash, he wanted to know "how it worked" with a view to mimicking existing trading formulas and predicting what was coming next. His results speak for themselves as he continually refines the methodology.
Alistair Strang is a freelance contributor and not a direct employee of Interactive Investor. All correspondence is with Alistair Strang, who for these purposes is deemed a third-party supplier. Buying, selling and investing in shares is not without risk. Market and company movement will affect your performance and you may get back less than you invest. Neither Alistair Strang or Interactive Investor will be responsible for any losses that may be incurred as a result of following a trading idea.
These articles are provided for information purposes only. Occasionally, an opinion about whether to buy or sell a specific investment may be provided by third parties. The content is not intended to be a personal recommendation to buy or sell any financial instrument or product, or to adopt any investment strategy as it is not provided based on an assessment of your investing knowledge and experience, your financial situation or your investment objectives. The value of your investments, and the income derived from them, may go down as well as up. You may not get back all the money that you invest. The investments referred to in this article may not be suitable for all investors, and if in doubt, an investor should seek advice from a qualified investment adviser.
Full performance can be found on the company or index summary page on the interactive investor website. Simply click on the company's or index name highlighted in the article.