S&P 500 index: key numbers to look out for
With the US tech index in record territory, our chartist sees is the S&P 500 go the same way?
6th July 2020 08:59
by Alistair Strang from Trends and Targets
With the US tech index in record territory, our chartist sees is the S&P 500 go the same way?

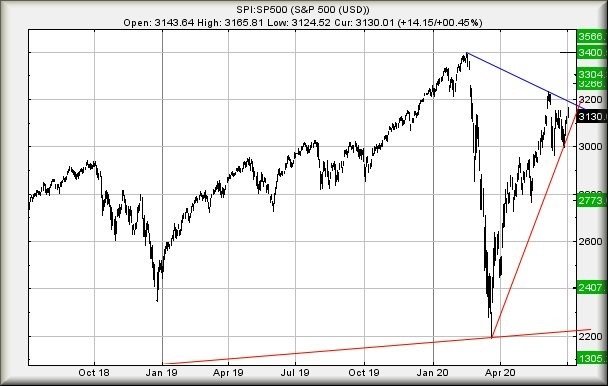
The S&P 500 (SPI:SP500)
The Nasdaq US tech index, now sailing higher than ever before, may perhaps be giving a suggestion of what's ahead for the broader S&P 500 index and Wall Street.
We struggle to find any logic behind the Nasdaq behaving as if Covid-19 has never happened, but suspect arithmetic may have something to do with it.
One of these silly stock market sayings, 'the price needs to go down before it goes up!' often has a basis in fact.
In the case of virtually everything, either in the UK or the USA, the associated arithmetic threatens some extraordinary price movements once shares, indices, and commodities start exceeding recovery trigger levels.
In the case of the S&P, we're inclined to regard the Nasdaq as creating a recovery benchmark, and this calculates at 3,229 points for the SP500 index.
The big picture calculates with movement next above 3,229 providing an ambition of 3,400 points initially with secondary, if exceeded, giving 3,566 as a pretty major point of interest.
Visually, achieving our initial 3,400 will doubtless provide some hesitation, thanks to it matching the pre-Covid-19 high of February this year.
With all this potential excitement, it's probably worth looking for any near-term scenario which should prove capable of hitting a trigger level.
Allegedly, moves next above 3,200 (The immediate blue downtrend) should bring travel to 3,266 initially with secondary, if bettered, at 3,304 points.
Given both targets threaten the trigger level of 3,229 being exceeded, this should give early warning of some big picture arithmetic kicking in.
For things to start going seriously wrong, we do have a couple of items worth considering.
Firstly, below 3,000 points risks breaking the immediate uptrend, allowing reversal to an initial 2,773 with secondary, when broken, down at 2,407 points.
Source: Trends and Targets Past performance is not a guide to future performance
Alistair Strang has led high-profile and "top secret" software projects since the late 1970s and won the original John Logie Baird Award for inventors and innovators. After the financial crash, he wanted to know "how it worked" with a view to mimicking existing trading formulas and predicting what was coming next. His results speak for themselves as he continually refines the methodology.
Alistair Strang is a freelance contributor and not a direct employee of Interactive Investor. All correspondence is with Alistair Strang, who for these purposes is deemed a third-party supplier. Buying, selling and investing in shares is not without risk. Market and company movement will affect your performance and you may get back less than you invest. Neither Alistair Strang, or interactive investor will be responsible for any losses that may be incurred as a result of following a trading idea.
Alistair Strang has led high-profile and "top secret" software projects since the late 1970s and won the original John Logie Baird Award for inventors and innovators. After the financial crash, he wanted to know "how it worked" with a view to mimicking existing trading formulas and predicting what was coming next. His results speak for themselves as he continually refines the methodology.
Alistair Strang is a freelance contributor and not a direct employee of Interactive Investor. All correspondence is with Alistair Strang, who for these purposes is deemed a third-party supplier. Buying, selling and investing in shares is not without risk. Market and company movement will affect your performance and you may get back less than you invest. Neither Alistair Strang or Interactive Investor will be responsible for any losses that may be incurred as a result of following a trading idea.
These articles are provided for information purposes only. Occasionally, an opinion about whether to buy or sell a specific investment may be provided by third parties. The content is not intended to be a personal recommendation to buy or sell any financial instrument or product, or to adopt any investment strategy as it is not provided based on an assessment of your investing knowledge and experience, your financial situation or your investment objectives. The value of your investments, and the income derived from them, may go down as well as up. You may not get back all the money that you invest. The investments referred to in this article may not be suitable for all investors, and if in doubt, an investor should seek advice from a qualified investment adviser.
Full performance can be found on the company or index summary page on the interactive investor website. Simply click on the company's or index name highlighted in the article.