Sterling vs US dollar: when will pound's misery end?
His charts were accurate when he last reviewed the British pound's relationship with the dollar, but it's time for independent analyst Alistair Strang to update his forecasts.
28th September 2023 07:36
by Alistair Strang from Trends and Targets
There are times when it can pay dividends to take a really big picture view of something. Back in January, we reviewed sterling vs US dollar with a calculation which suggested the price risked challenging the Blue downtrend.
As the months rolled beneath us, the pairing eventually issued such a challenge, topping out at $1.315 in July before retreating in confusion. What interested us about this was that our calculation in January gave $1.333 as a viable ambition, this number obviously declining every month. When the relationship hit $1.315, we’d no calculations giving such an ambition and the only thing capable of provoking reversal was the Blue downtrend.
- Invest with ii: Top UK Shares | Share Tips & Ideas | Open a Trading Account
Sometimes, trend lines can be important, especially as our raison d’être is to monitor how prices are reacting to trend lines. Sometimes, after all, they can just be meaningless crayon lines but, in this instance, it seems clear the markets are regarding Blue as important. Should this be the case, Blue currently represents a level of 1.3039 (roughly) and, above such, it seems a Long position should reward anyone speculating.
After all, it’s not often we are presented with tangible proof the market views a particular trend line as important.
Alas, since the relationship attempted a challenge of Blue, things appear be going horribly wrong for sterling as its retreat against the dollar has proven quite merciless.
Currently, it’s the case where below $1.2110 presents the potential of relaxation to an initial $1.2081. While this isn’t a massive drop in the grand scheme of things, a visit to $1.2081 will represent a price level around which we’d conventionally hope for a solid bounce.
The implication, should $1.2081 break, allows our calculation giving $1.1710 as viable. And should this level be trashed, we can even supply a third drop target at $1.1512 as a point by which the pairing really must rebound.
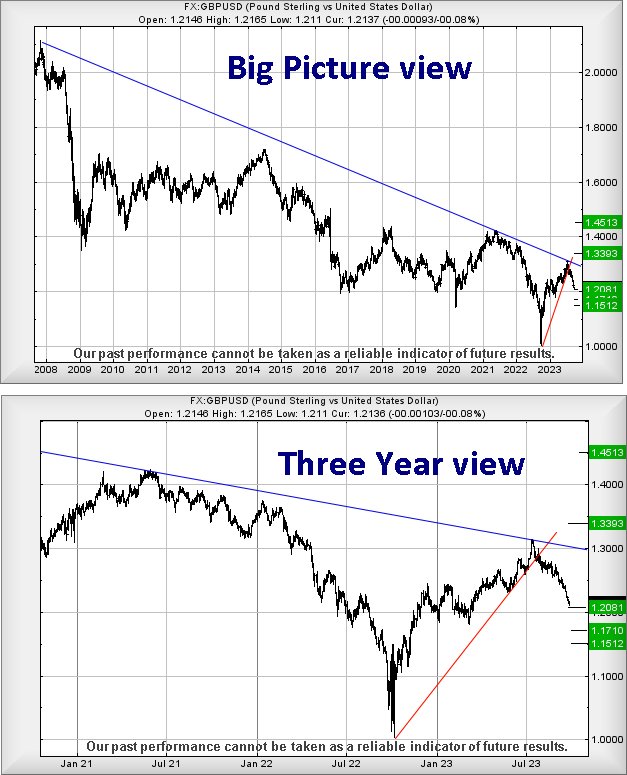
Source: Trends and Targets. Past performance is not a guide to future performance.
Unfortunately, if daring to ride this dodgy gravy train to the bottom, it appears the tightest stop loss level shall require to be quite wide at $1.2880, though there’s a vague chance $1.2556 shall suffice for a bunch of complex reasons.
Our reading of the recovery prospects is muddied by a demand to take a time element into consideration. Above $1.2556 calculates with the potential of a lift to $1.2976, potentially with the chance of breaking above Blue on the chart and triggering some proper recovery for sterling.
Such a scenario currently allows for recovery to $1.3393 with secondary, a longer term $1.4513. This sort of thing is liable to become game changing for the future, taking sterling into unfamiliar territory where a future surge to $1.71 becomes possible.
Alistair Strang has led high-profile and "top secret" software projects since the late 1970s and won the original John Logie Baird Award for inventors and innovators. After the financial crash, he wanted to know "how it worked" with a view to mimicking existing trading formulas and predicting what was coming next. His results speak for themselves as he continually refines the methodology.
Alistair Strang is a freelance contributor and not a direct employee of Interactive Investor. All correspondence is with Alistair Strang, who for these purposes is deemed a third-party supplier. Buying, selling and investing in shares is not without risk. Market and company movement will affect your performance and you may get back less than you invest. Neither Alistair Strang or Interactive Investor will be responsible for any losses that may be incurred as a result of following a trading idea.
These articles are provided for information purposes only. Occasionally, an opinion about whether to buy or sell a specific investment may be provided by third parties. The content is not intended to be a personal recommendation to buy or sell any financial instrument or product, or to adopt any investment strategy as it is not provided based on an assessment of your investing knowledge and experience, your financial situation or your investment objectives. The value of your investments, and the income derived from them, may go down as well as up. You may not get back all the money that you invest. The investments referred to in this article may not be suitable for all investors, and if in doubt, an investor should seek advice from a qualified investment adviser.
Full performance can be found on the company or index summary page on the interactive investor website. Simply click on the company's or index name highlighted in the article.