Stockwatch: Contrarians, accumulate this 6% yield now
13th December 2016 11:58
by Edmond Jackson from interactive investor
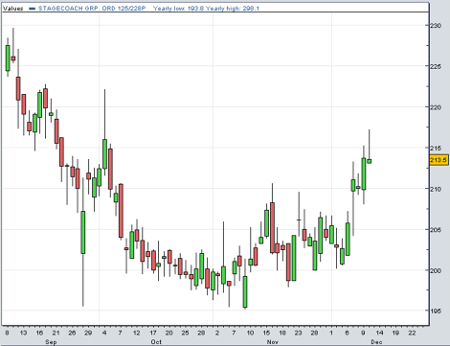
Does a classic "bowl" shape on the chart of mid-cap public transport group signal good times ahead? This is a classic break-out pattern that could evolve into a "cup and handle" recovery - a bowl shaped chart followed by a slight retracement - at least by way of technical analysis.
Over the last 18 months Stagecoach's price has had quite a ride: the shares had halved from 420p to 196p by November, before recovering to about 215p on the back of last week's interims - thus a bowl pattern.
But the numbers for the six months to 29 October were actually flat, at best. Revenue increased 1.6% to just over £2 billion, while adjusted earnings per share (EPS) dropped 15.3% to 14.4p - albeit in line with expectations - as operating profit before exceptionals fell 19.1% to £117.0 million, hit by weakness in UK rail.
The interim dividend rose 8.6% to 3.8p, however, as management are confident in the long-term prospects for public transport.
They said: "There is a large market opportunity for modal shift from cars to public transport against a backdrop of population growth, urbanisation, technological advancements, and increasing pressure to tackle road congestion and improve air quality."
OPEC
The stock yields 5.65%, which is twice covered by forward earnings and backed by a cash flow profile that is also roughly twice earnings. So with the bad news likely priced in, a near 6% income looks fair compensation for holding the risks until the story improves.
Be careful though, the business is a complex one. While higher oil prices will increase operating costs for the former, more expensive fuel will encourage travel on public transport over cars and planes.
The market clearly believes higher oil prices will underpin public transport in the long run, however, as OPEC's decision to cut production in November triggered a share price rally, along with this weekend's commitment from non-OPEC members.
If a recession upset is avoided, tepid growth is more likely to favour public transportThe latest interims to 29 October hardly inspire by way of numbers and narrative, but they do meet expectations after a big share price fall.
The single-figure forward price/earnings (PE) multiple compares with an historic annual average of 11.9-14.9 between in the three years to 2015, and a much higher yield.
The price is, therefore, sensitive to any hint of improved prospects, like the dividend rise underlining management's belief in a long-term shift from cars to public transport.
The business is potentially cyclical, but a recent forecast from the British Chambers of Commerce suggests UK GDP will grow by 1.1% next year, marginally better than September's forecast.
So long as a recession upset is avoided, tepid growth is more likely to favour public transport. The chief risk is terrorist attacks stunning public confidence a while.
The board is probably safe to raise the payout, as it's not by too much and the end-October balance sheet boasted £341.4 million cash - even if it was down 10.7%.
While £114.4 million was invested, £130.8 million of liabilities was repayed in the period and £45.3 million was paid out as dividends.
Operations lagging
There's no real improvement in operations yet. There was little to no increase in ticket prices as the majority of bus operations battled against weak economic conditions, lower fuel prices, worsening road works/congestion and higher competition.
Meanwhile, UK Rail's operating profit slumped 53.2% amid poor Network Rail performance - passenger growth on South West Trains and Virgin Trains East Coast weren't enough to cover the higher operating costs and government payments.
Stagecoach's Virgin Rail JV (49% share) saw a 3% rise in operating profit Scant revenue growth of 0.8% was, however, in line with industry growth of 2% after adjusting for one-off and timing issues.
As a relatively pricey form of travel, rail is quite sensitive to economic conditions - at least for leisure purposes.
Exorbitant London property prices spurring more commuting may help explain the success of the Virgin Rail joint venture (49% share) which saw a 3% rise in operating profit as the West Coast franchise performs ahead of expectations; this at least appears a medium-term success story.
In the US however, a "Twin America" rail joint venture is barely profitable amid strong competition, its carrying value reduced to nil.
Despite the Trump stock-rally and dollar strength, it doesn't look as if Stagecoach's US operations will become a sweet spot soon.
Operating profit fell 17.8% in the US bus division as revenue/margin slippedThis conveys Stagecoach as a "price-taker", which explains the slip in operating margin from 13.8% to 13.0% in UK regional bus.
The London Bus margin also reduced from 7.5% to 6.9%, as staff and other costs offset lower fuel prices, although operations are said to be well-placed to capitalise on new/extended contracts by Transport for London in years ahead.
Significantly weaker, operating profit fell 17.8% in its US bus division as revenue/margin slipped, with lower fuel prices blamed for increased car/air competition especially in the inter-city coach market.
So the short to medium-term operations story is a turn-off, but a valuation opportunity has been created longer-term based on higher public transport demand.
Balance sheet issues manageable
The table shows slightly negative net tangible assets relating to £818.1 million trade payables (versus £408.6 million receivables) and £822.8 million borrowings. Goodwill/intangibles are comparably less at £243.6 million.
Net debt rose 21.3% to £484.4 million in the first-half year reflecting investment in the bus fleet and the timing of interest payments on bonds; meanwhile working capital movements helped net cash from operations jump 80.7% to £142.9 million.
Stagecoach's investment-grade credit rating should help it bid with confidence for franchisesIn this context, an interim net finance cost down 28.1% to £16.6 million (after a bond refinancing at a lower interest rate) is manageable versus the cash demands.
Mind, the pension fund has worsened from a net assets/obligations deficit of £96.7 million to £234.9 million mainly due to £137.1 million actuarial losses in the first half versus £80.0 million like-for like gains.
So the balance sheet, while no major risk in a downturn, is no prop either. Stagecoach does at least retain an investment grade credit rating, which should help it bid with confidence for franchise competitions expected over the next two years.
For event-driven buyers, Stagecoach is more "wait and see"; however, a long-term opportunity has been created for contrarians to accumulate. The "bowl" chart coincides with rising oil prices and a near 6% yield is well-backed by cash.
For more information see the website.
| Stagecoach Group - financial summary | Consensus estimates | ||||||
|---|---|---|---|---|---|---|---|
| year ended 30 Apr | 2012 | 2013 | 2014 | 2015 | 2016 | 2017 | 2018 |
| Turnover (£ million) | 2,591 | 2,805 | 2,930 | 3,204 | 3,871 | ||
| IFRS3 pre-tax profit (£m) | 240 | 154 | 158 | 165 | 104 | ||
| Normalised pre-tax profit (£m) | 201 | 164 | 170 | 172 | 137 | 175 | 161 |
| Operating margin (%) | 8.1 | 6.5 | 6.9 | 5.6 | 4.7 | ||
| IFRS3 earnings/share (p) | 29.1 | 21.7 | 22.9 | 24.1 | 17.0 | ||
| Normalised earnings/share (p) | 22.5 | 23.3 | 23.9 | 25.2 | 21.8 | 25.1 | 22.9 |
| Earnings per share growth (%) | -0.1 | 3.6 | 2.5 | 5.6 | -13.3 | 14.7 | -8.6 |
| Price/earnings multiple (x) | 9.8 | 8.5 | 9.3 | ||||
| Annual average historic P/E (x) | 11.9 | 13.8 | 15.8 | 14.9 | 10.6 | ||
| Cash flow/share (p) | 40.3 | 54.6 | 43.2 | 54.9 | 48.6 | ||
| Capex/share (p) | 17.7 | 23.4 | 20.7 | 25.6 | 32.1 | ||
| Dividends per share (p) | 7.3 | 8.0 | 8.9 | 9.8 | 10.8 | 11.9 | 12.2 |
| Yield (%) | 5.1 | 5.6 | 5.7 | ||||
| Covered by earnings (x) | 3.0 | 3.0 | 2.7 | 2.6 | 2.0 | 2.1 | 1.9 |
| Net tangible assets per share (p) | -28.8 | -24.5 | -11.9 | -21.5 | -8.6 | ||
| Source: Company REFS | |||||||
This article is for information and discussion purposes only and does not form a recommendation to invest or otherwise. The value of an investment may fall. The investments referred to in this article may not be suitable for all investors, and if in doubt, an investor should seek advice from a qualified investment adviser.
These articles are provided for information purposes only. Occasionally, an opinion about whether to buy or sell a specific investment may be provided by third parties. The content is not intended to be a personal recommendation to buy or sell any financial instrument or product, or to adopt any investment strategy as it is not provided based on an assessment of your investing knowledge and experience, your financial situation or your investment objectives. The value of your investments, and the income derived from them, may go down as well as up. You may not get back all the money that you invest. The investments referred to in this article may not be suitable for all investors, and if in doubt, an investor should seek advice from a qualified investment adviser.
Full performance can be found on the company or index summary page on the interactive investor website. Simply click on the company's or index name highlighted in the article.
Disclosure
We use a combination of fundamental and technical analysis in forming our view as to the valuation and prospects of an investment. Where relevant we have set out those particular matters we think are important in the above article, but further detail can be found here.
Please note that our article on this investment should not be considered to be a regular publication.
Details of all recommendations issued by ii during the previous 12-month period can be found here.
ii adheres to a strict code of conduct. Contributors may hold shares or have other interests in companies included in these portfolios, which could create a conflict of interests. Contributors intending to write about any financial instruments in which they have an interest are required to disclose such interest to ii and in the article itself. ii will at all times consider whether such interest impairs the objectivity of the recommendation.
In addition, individuals involved in the production of investment articles are subject to a personal account dealing restriction, which prevents them from placing a transaction in the specified instrument(s) for a period before and for five working days after such publication. This is to avoid personal interests conflicting with the interests of the recipients of those investment articles.