Stockwatch: two equity portfolio building blocks to consider
Either of these companies make a good candidate for inclusion in a personal pension, believes analyst Edmond Jackson, with capital protection as important as growth.
24th October 2025 12:19
by Edmond Jackson from interactive investor

Can the rally in FTSE 100 power networks stocks last? The past four weeks have seen near-identical 11% rallies in National Grid (LSE:NG.) and SSE (LSE:SSE), which begs the question of whether a fundamental re-rating is under way or if profit-taking is inevitable. Both exhibit quite volatile charts albeit in an overall long-term uptrend.
- Invest with ii: SIPP Account | Stocks & Shares ISA | See all Investment Accounts
With these stocks outperforming the FTSE 100 index, which has risen 4% since early September, it might reflect strong market positions in essential services and, despite fossil fuels resurging in the political debate, is the market acknowledging their investment in renewables?
There has been a consistent 11% rally in National Grid from 1,035p on 20 September to an all-time high of around of 1,140p currently. A £57 billion capitalisation puts it on a 12-month forward price/earnings (PE) ratio near 14x and yielding 4.2% with around 1.7x anticipated earnings cover.
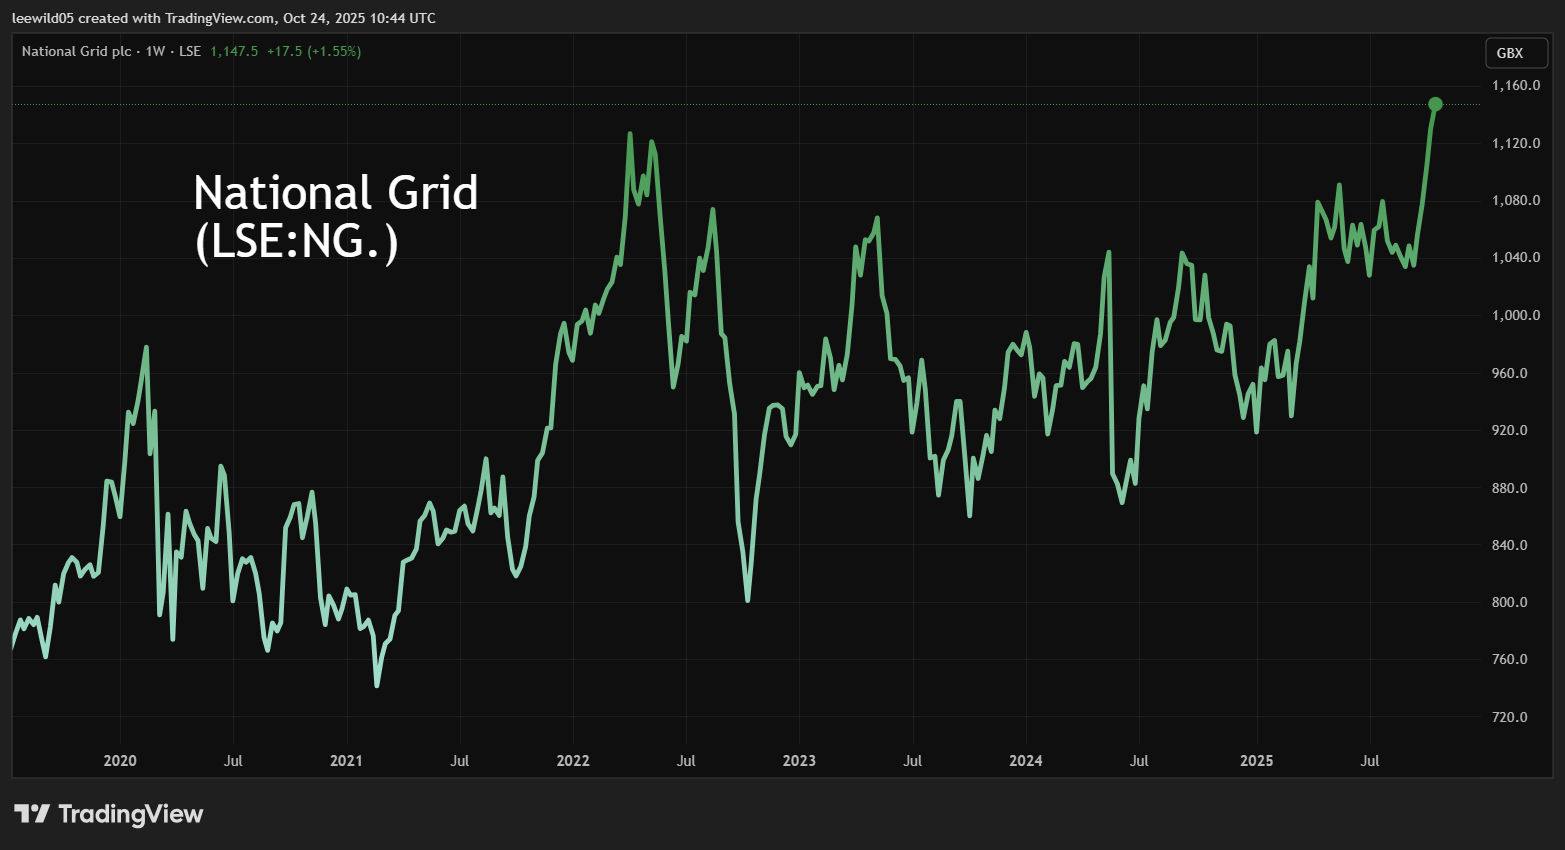
Source: TradingView. Past performance is not a guide to future performance.
SSE’s recent rally also began in early September, and is up 17% to 1,880p versus last July’s all-time high of 1,970p. Amid a volatile earnings trend lately, a forward PE around 11x quite depends on the perspective in time, while the projected yield is around 3.7% covered over twice by expected earnings.
Again, we see a very similar, gently upwards but volatile trend:
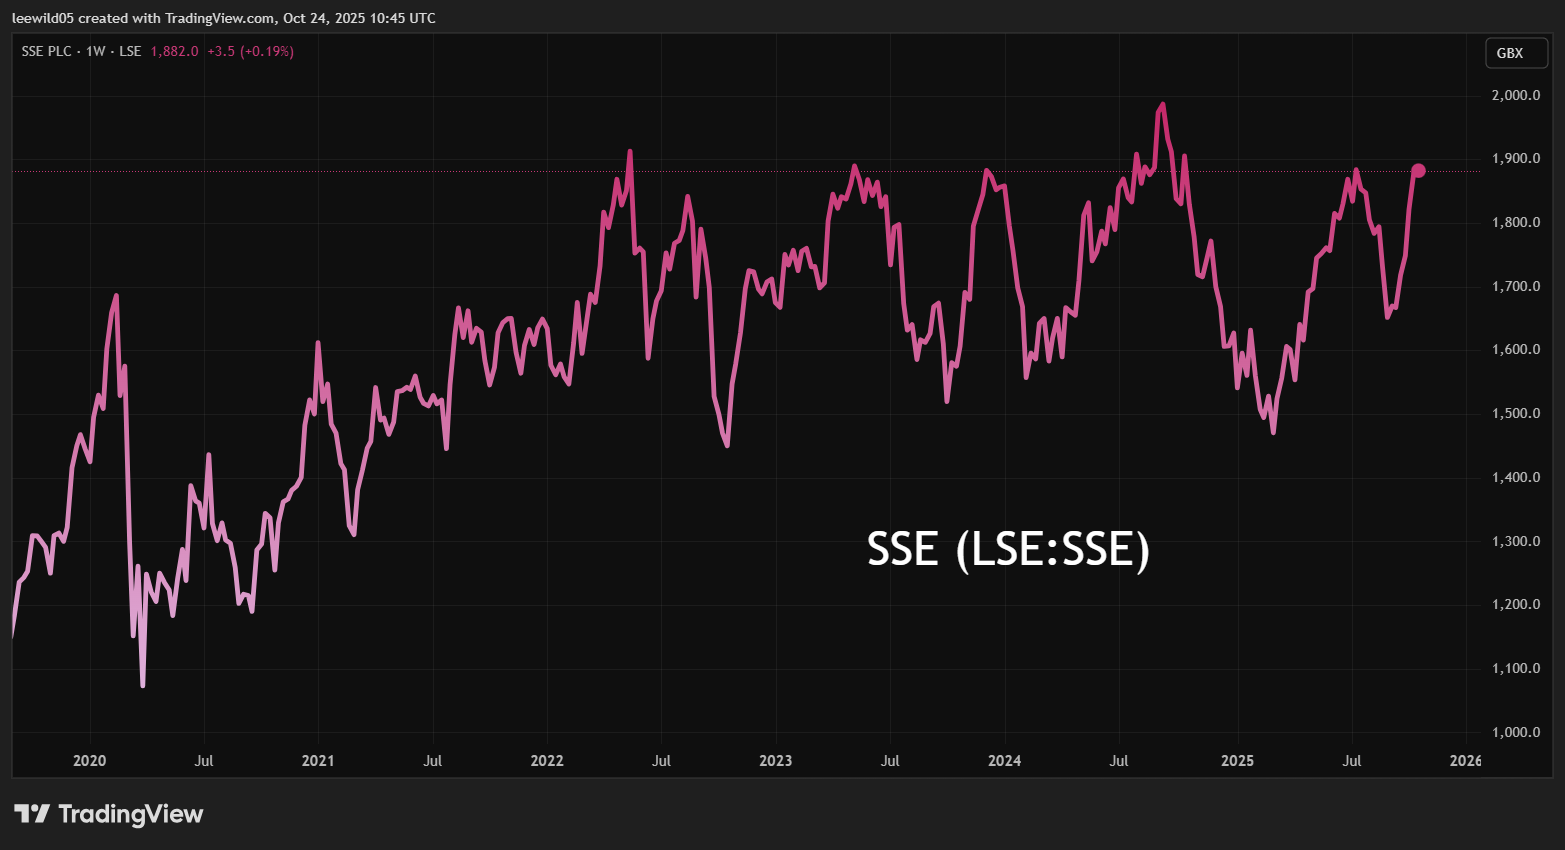
Source: TradingView. Past performance is not a guide to future performance.
No fresh upgrades driving this rally
As if knowing inevitable comparisons by investors, both companies have a 31 March year end and on 2 October issued pre-close updates for the first half to 30 September. These were essentially “in line”, hence rising shares seem partly to relate to the wider market trend but also a general shift in investor perception.
Sceptics might even have been wary of National Grid declaring earnings per share (EPS) to be second-half weighted, a trait that generally can prove to be an initial mild profit warning. This relates to the US, which accounts for 44% of operating profit, whereas UK electricity transmission is expected to be a more consistent performer over the financial year.
- ii view: SSE earnings slowed by spring drought
- The Income Investor: an alternative for those mulling shift to cash
SSE cited EPS playing out according to “usual seasonal averages”, with full-year expectations unchanged and on track to deliver March 2027 adjusted EPS of 175p to 200p; the median implies a 17-month forward PE just above 10x.
Neither PE ratings nor their relation to medium-term earnings, nor yield, are particularly exciting, but looking at the past five years of financial data both companies sport strong operating margins often well over 20%. It is somewhat concerning how National Grid has seen free cash flow per share dip negatively due to high capital expenditure – especially last year – which is a reminder of how a monopoly position in electricity and gas transmission comes with strict regulation by Ofgem, and while the company also invests in renewables.
National Grid - financial summary
Year end 31 Mar
| 2020 | 2021 | 2022 | 2023 | 2024 | 2025 | |
| Turnover (£ million) | 14,540 | 13,665 | 18,260 | 21,659 | 19,850 | 18,378 |
| Operating margin (%) | 19.1 | 17.6 | 23.9 | 22.5 | 22.5 | 26.8 |
| Operating profit (£m) | 2,780 | 2,401 | 4,371 | 4,879 | 4,475 | 4,934 |
| Net profit (£m) | 1,264 | 1,640 | 2,353 | 7,797 | 2,290 | 2,902 |
| EPS - reported (p) | 33.6 | 33.8 | 55.5 | 67.9 | 54.9 | 59.8 |
| EPS - normalised (p) | 46.1 | 38.4 | 37.5 | 47.2 | 63.9 | 67.5 |
| Operating cashflow/share (p) | 122 | 116 | 159 | 173 | 171 | 141 |
| Capital expenditure/share (p) | 129 | 124 | 141 | 172 | 185 | 197 |
| Free cashflow/share (p) | -7.0 | -8.0 | 18.0 | 1.0 | -14.0 | -56.0 |
| Dividends per share (p) | 44.6 | 45.2 | 46.8 | 51.0 | 57.0 | 46.7 |
| Covered by earnings (x) | 0.8 | 0.7 | 1.2 | 1.3 | 1.0 | 1.3 |
| Return on total capital (%) | 4.7 | 4.2 | 6.2 | 5.8 | 5.2 | 5.1 |
| Cash (£m) | 2,071 | 2,499 | 3,349 | 2,768 | 4,258 | 6,931 |
| Net debt (£m) | 28,723 | 28,721 | 42,116 | 40,217 | 42,814 | 40,608 |
| Net assets (£m) | 19,771 | 19,839 | 23,833 | 29,538 | 29,867 | 37,803 |
| Net assets per share (p) | 470 | 466 | 545 | 804 | 803 | 772 |
Source: company accounts.
SSE also has a monopoly in Northern Scottish electricity transmission and some gas supply in Northern Ireland. Its free cash flow dipped negatively in the March 2023 year and deeply so last year. In respect of the March 2024 year, the dividend was de-based 38% to 60p from which it is again growing.
SSE - financial summary
Year end 31 Mar
| 2020 | 2021 | 2022 | 2023 | 2024 | 2025 | |
| Turnover (£ million) | 6,801 | 6,826 | 8,608 | 12,491 | 10,457 | 10,132 |
| Operating margin (%) | 14.2 | 38.9 | 43.7 | -1.2 | 24.9 | 19.4 |
| Operating profit (£m) | 966 | 2,656 | 3,759 | -146 | 2,609 | 1,963 |
| Net profit (£m) | -59.0 | 2,276 | 3,031 | -84.2 | 1,784 | 1,263 |
| EPS - reported (p) | 40.6 | 206 | 241 | -14.7 | 156 | 108 |
| EPS - normalised (p) | 64.5 | 113 | 140 | 50.2 | 184 | 144 |
| Operating cashflow/share (p) | 126 | 174 | 154 | 139 | 353 | 225 |
| Capital expenditure/share (p) | 117 | 113 | 138 | 169 | 230 | 285 |
| Free cashflow/share (p) | 9.0 | 61.0 | 16.0 | -30.0 | 123 | -60.0 |
| Dividends per share (p) | 80.0 | 81.0 | 85.7 | 96.7 | 60.0 | 64.2 |
| Covered by earnings (x) | 0.5 | 2.5 | 2.8 | -0.2 | 2.6 | 1.7 |
| Return on total capital (%) | 6.1 | 14.7 | 17.8 | -0.7 | 11.1 | 7.8 |
| Cash (£m) | 165 | 1,600 | 1,049 | 892 | 1,036 | 1,091 |
| Net debt (£m) | 10,008 | 7,810 | 8,015 | 8,168 | 8,098 | 9,514 |
| Net assets (£m) | 4,920 | 6,681 | 9,133 | 10,434 | 11,053 | 12,064 |
| Net assets per share (p) | 470 | 637 | 851 | 954 | 1,011 | 1,090 |
Source: company accounts.
This kind of disruption to cash returns would normally make me quite wary of a business. Furthermore, I notice National Grid is compromised by relatively costly financial debt. With 107% net gearing, £1.36 billion net finance costs took 27.5% of operating profit in the last financial year. SSE’s net gearing is also pretty high at around 80%, but with the help of £208 million finance income, the net interest charge clipped only 6% off operating profit. It is an initial factor tilting me to favour SSE in a comparison.
SSE’s bold earnings projection for March 2027
With consensus expecting around 25% EPS growth that year after 7% this, the medium-term dynamic is for normalised EPS of 192p to beat 184p in March 2024, although National Grid is also projected to achieve record EPS in March 2027 of 86.5p and without SSE’s 22% drop in the last year.
I would not get hung up on such variance and comparison of PEG (PE-to-growth) ratings which risk a false “snapshot value” - such as SSE currently on a deceptively attractive PEG of 0.5 simply due to recovery from last year’s drop. Such extent of earnings variance over the years is not really consistent with utilities offering financial reliability, but does at least help explain chart volatility.
A hedge in times of uncertainty
I believe attractiveness as a hedge has been a factor just lately, as we saw with gold prices strengthening hard in the last month or so. Sod’s law dictated that after I broadly maintained a “buy” stance on Greatland Resources Ltd (LSE:GGP) last Tuesday, gold prices plummeted.
However, the reasons why gold has been in demand haven’t changed, with the drop essentially market-technical, and JP Morgan yesterday iterated what I was saying about central bank buying and the economic context. It targets a price over $5,000 by the fourth quarter of 2026. It said: “With gold being our highest conviction long all year, we still believe it has higher to go as we enter into a Fed-cutting cycle.”
- Wild’s Winter Portfolios 2025-26: a return to form?
- Sign up to our free newsletter for investment ideas, latest news and award-winning analysis
Gold and related miners are obviously a lot livelier than utility shares but there are parallels in demand for both, and also fear of missing out once an uptrend is perceived. So, yes, the mood could turn anytime in National Grid and SSE, and on the downside similarly as latest upside had little to do with company news. Perhaps a lesson from Greatland, applicable here with fresh money, is to wait for current sentiment to expire and buy a useful drop.
How definitive is growth from renewables?
Contra to the reactionary stance of the Trump administration to prioritise fossil fuels, China definitively favours renewable energy spending, which reached 31% of the global total. In solar and wind capacity, China has surpassed its 2030 targets six years early. It is also investing heavily in related infrastructure such as grid upgrades and energy storage to manage increased capacity.
China is therefore a blueprint as to why, in economic terms, National Grid and SSE both rate “buy” on a long-term view – say as a building block in a self-invested personal pension (SIPP), taking a view of 10 years or more. According to the world’s largest economy, gaining on the US, this is a mega-trend.
However, it is a state-controlled economy enacting committed policy. In the UK, we seem similar to the US, with propensity at least for the renewables drive to falter. It is already in doubt, tied to the Labour government with Reform and the Conservatives emphasising how the pursuit of green energy and net zero has led to the UK having some of the highest energy costs globally, which are leading to stagflation.
- Where to invest in Q4 2025? Four experts have their say
- The Autumn Budget 2025: just how painful could it be?
In fractious democracies it just isn’t possible to have the same commitment as in some autocratic societies. For example, the post-World War Two Japanese economic miracle, substantially orchestrated by Japan’s ministry of trade and industry.
So, while I don’t doubt the resolve of both these companies towards cleaner energy, the UK policy context has uncertainties – likewise the US for National Grid. It is executing £60 billion of investment over five years – near enough its entire present market value – in support of a 6-8% compound annual growth rate in underlying EPS to March 2029. This will partly explain occasions such as recently when the shares beat the wider market. It has also meant a £7 billion share issue mid-2024 and £41 billion net debt.
SSE has a “net-zero acceleration programme” and is investing £17.5 billion over five years to March 2027. Similarly, I find it hard to quantify the financial upshot for shareholders when the UK policy context seems potentially so fluid.
My essential view is that both shares are a long-term “buy”, especially for a pension where capital protection is as important as growth. Yet it is a broad-based view and hard to argue for concentrated holdings given this blend of UK/US renewables’ uncertainty alongside monopolist electricity/gas supply.
Edmond Jackson is a freelance contributor and not a direct employee of interactive investor.
Important information – SIPPs are aimed at people happy to make their own investment decisions. Investment value can go up or down and you could get back less than you invest. You can normally only access the money from age 55 (57 from 2028). We recommend seeking advice from a suitably qualified financial adviser before making any decisions. Pension and tax rules depend on your circumstances and may change in future.
These articles are provided for information purposes only. Occasionally, an opinion about whether to buy or sell a specific investment may be provided by third parties. The content is not intended to be a personal recommendation to buy or sell any financial instrument or product, or to adopt any investment strategy as it is not provided based on an assessment of your investing knowledge and experience, your financial situation or your investment objectives. The value of your investments, and the income derived from them, may go down as well as up. You may not get back all the money that you invest. The investments referred to in this article may not be suitable for all investors, and if in doubt, an investor should seek advice from a qualified investment adviser.
Full performance can be found on the company or index summary page on the interactive investor website. Simply click on the company's or index name highlighted in the article.
Disclosure
We use a combination of fundamental and technical analysis in forming our view as to the valuation and prospects of an investment. Where relevant we have set out those particular matters we think are important in the above article, but further detail can be found here.
Please note that our article on this investment should not be considered to be a regular publication.
Details of all recommendations issued by ii during the previous 12-month period can be found here.
ii adheres to a strict code of conduct. Contributors may hold shares or have other interests in companies included in these portfolios, which could create a conflict of interests. Contributors intending to write about any financial instruments in which they have an interest are required to disclose such interest to ii and in the article itself. ii will at all times consider whether such interest impairs the objectivity of the recommendation.
In addition, individuals involved in the production of investment articles are subject to a personal account dealing restriction, which prevents them from placing a transaction in the specified instrument(s) for a period before and for five working days after such publication. This is to avoid personal interests conflicting with the interests of the recipients of those investment articles.