Technical analysis: RBS, Glencore, Ferrari
Our analyst updates last week's forecasts and discusses where share prices could go next.
8th July 2019 09:08
by Alistair Strang from Trends and Targets
Our analyst updates last week's forecasts and discusses where share prices could go next.

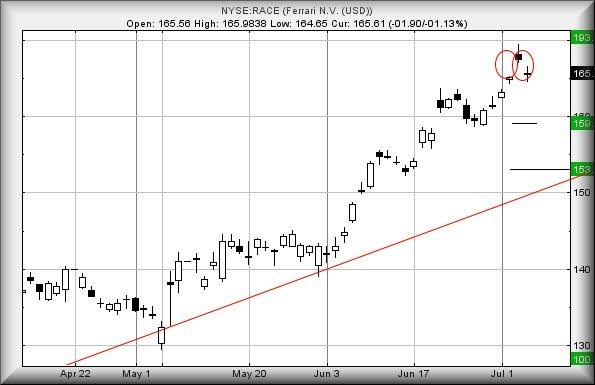
Ferrari (NYSE:RACE) is proving a bit of a near term worry. The share price quite cheerfully traded beyond $165, almost touching the $170 level before a slight fallback. Our scenario allows for moves above $165 reaching $188 initially!
Our slight concern comes from the share price being gapped up on Thursday, then gapped down on Friday. If the market intends to play a GaGa tune, this should suggest coming weakness to $159 before any further surge upward.
The issue comes, if $159 breaks, as it could easily reverse to $153 and a possible future bonk against the red uptrend. At present, the price requires close below red at $150 to cancel the prospect of $188 in Ferrari future.
Source: Trends and Targets Past performance is not a guide to future performance
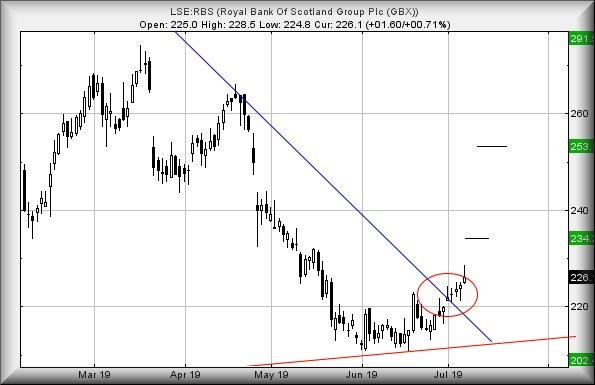
RBS (LSE:RBS) appears to have triggered movement upward towards 234p, reaching the dizzy height of 229p so far.
Remarkably, it remains the case of above 234p allowing a longer-term stronger rise to 253p. Unfortunately, we still distrust this share, and our weasel worded demand that the price close above 234p to force a rise to be taken seriously remains as valid now as it was a week ago.
The retail banks had all been on board for a bit of a thrashing, but the continued Brexit delays appear to have placed their share prices in a holding pattern.
In plain English, we suspect drops have been delayed but not cancelled. The dangerous number for RBS remains of movement below 212p.
Source: Trends and Targets Past performance is not a guide to future performance
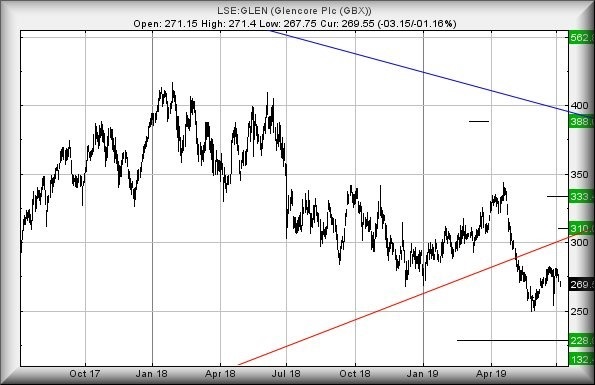
Glencore (LSE:GLEN), while not having vanished down a rabbit hole, shows little sign of avoiding such a doom.
The share price still requires to exceed 300p to get out of trouble though, visually, we'd raise an eyebrow if it even managed stumble above 282p as some sort of glass ceiling appears to be forming.
Even above 283p now hints at 312p proving a valid ambition, along with some sort of miracle recovery. We have our doubts.
Source: Trends and Targets Past performance is not a guide to future performance
Alistair Strang has led high-profile and "top secret" software projects since the late 1970s and won the original John Logie Baird Award for inventors and innovators. After the financial crash, he wanted to know "how it worked" with a view to mimicking existing trading formulas and predicting what was coming next. His results speak for themselves as he continually refines the methodology.
Alistair Strang is a freelance contributor and not a direct employee of Interactive Investor. All correspondence is with Alistair Strang, who for these purposes is deemed a third-party supplier. Buying, selling and investing in shares is not without risk. Market and company movement will affect your performance and you may get back less than you invest. Neither Alistair Strang or Interactive Investor will be responsible for any losses that may be incurred as a result of following a trading idea.
These articles are provided for information purposes only. Occasionally, an opinion about whether to buy or sell a specific investment may be provided by third parties. The content is not intended to be a personal recommendation to buy or sell any financial instrument or product, or to adopt any investment strategy as it is not provided based on an assessment of your investing knowledge and experience, your financial situation or your investment objectives. The value of your investments, and the income derived from them, may go down as well as up. You may not get back all the money that you invest. The investments referred to in this article may not be suitable for all investors, and if in doubt, an investor should seek advice from a qualified investment adviser.
Full performance can be found on the company or index summary page on the interactive investor website. Simply click on the company's or index name highlighted in the article.