Three reasons to be bullish – and three reasons to worry
Stocks have been hitting new highs, but not everyone’s convinced that the good times will last. So Russell’s breaking down what’s on the minds of the optimists and the pessimists.
7th November 2025 08:55
by Russell Burns from Finimize

- Strong corporate earnings, ongoing interest rate cuts, and rising global liquidity have been giving stocks a boost – and those things haven’t changed. So that could keep pushing prices higher in the months ahead
- But AI valuations are starting to look frothy, private market risks are building, and gold may have overheated after a huge run-up
- You don’t need to side with the market’s bulls or its bears. Instead, you could stay diversified, manage your risk, and prepare for a range of outcomes.
Markets have been in a strange place lately. US stocks have been flirting with all-new highs. Gold – the traditional safe haven – has climbed nearly 50% into record territory. But, at the same time, seemingly everywhere you turn, people have been asking whether an AI bubble is just about to pop.
So it’s a good time to zoom in and take a look at why some folks are optimistic and why others are deeply sceptical.
Three reasons to stay bullish
The bandwagon can be a pretty fun ride. And, fair enough, no one wants to be on it when it crashes. But there’s a good chance that won’t happen for a while. After all, it’s being powered by a trio of strong forces.
First, company profits are generally roaring. Earnings are arguably the most important driver of stock prices over the long term. And the latest batch of quarterly updates has not been too shabby. As of a few days ago, 87% of S&P 500 companies have reported positive earnings surprises, beating forecasts by an average of 7.6% and running well above their ten-year averages. And, if that wasn’t impressive enough, this is the ninth-straight quarter of year-over-year profit growth.
Second, central banks are in rate-cutting mode. Over the past two years, the world’s central banks have made 312 interest rate cuts, according to the latest stats from Bank of America. And – as of the end of last month – US nominal economic output (that is, the value of the goods and services produced on a yearly basis) was up 11%. Compare that to the two years following the height of the global financial crisis: during that period, there were 313 global rate cuts, and US nominal output was down 2.5%.
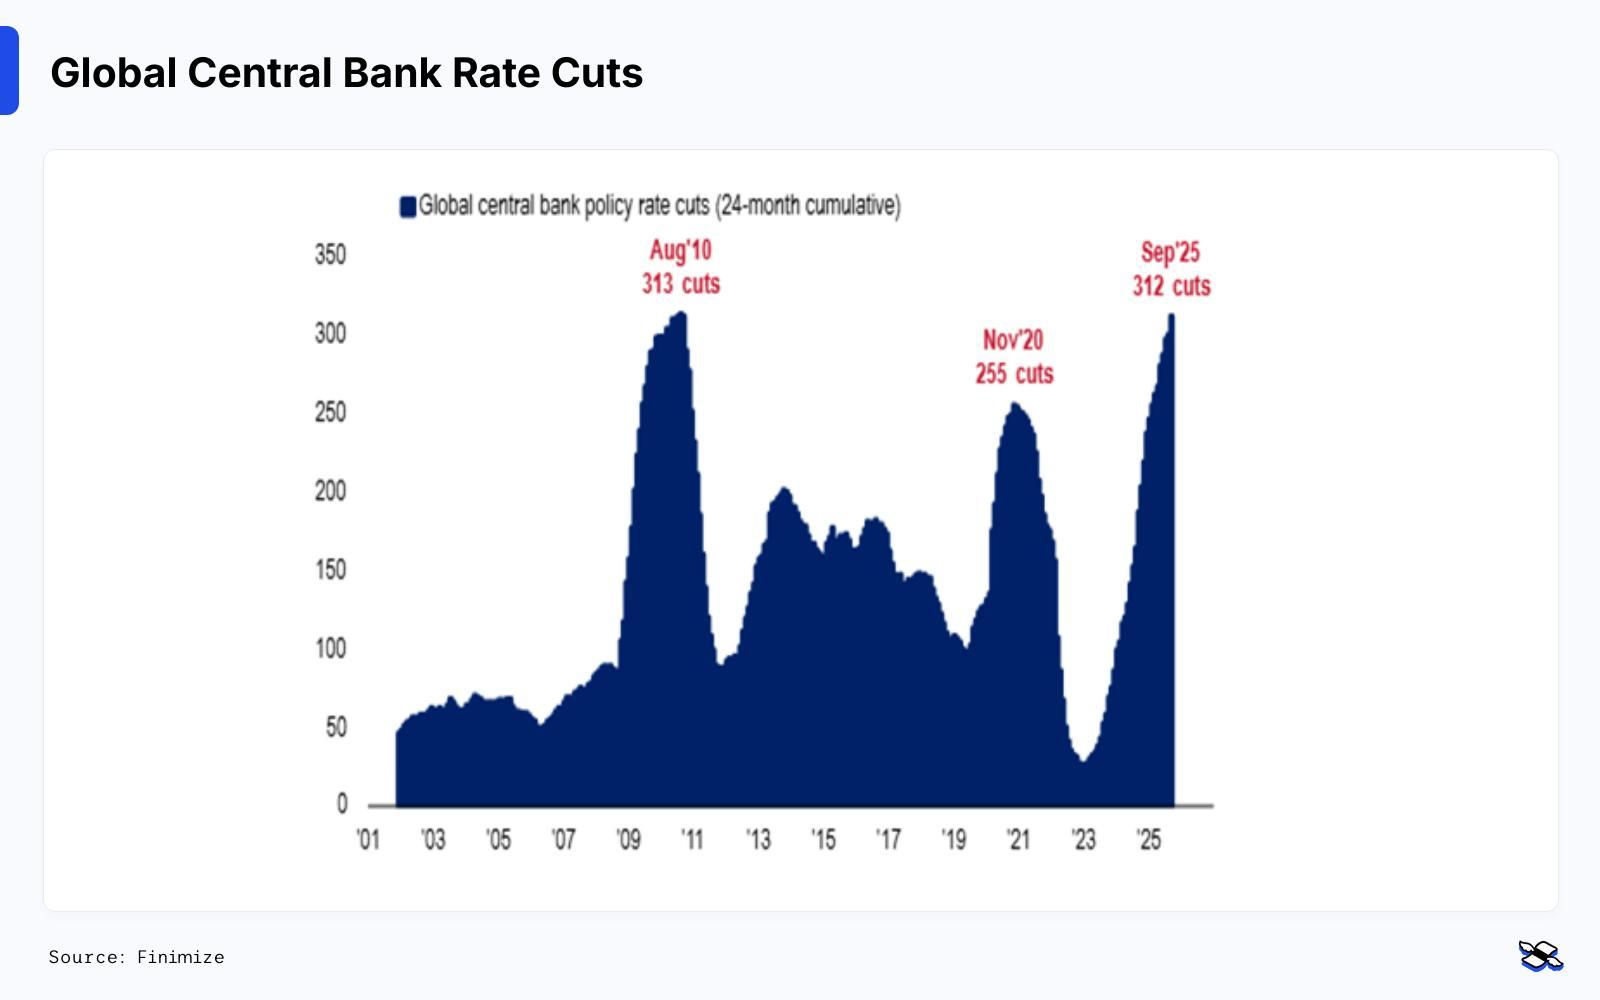
The world’s central banks have been trimming interest rates: the total number of cuts made over a two-year stretch, from 2002 to 2025. Source: Bank of America.
Lower interest rates naturally boost economic growth and stock valuations, because they increase the present value of future cash flows. So no surprise, then, stocks are sitting at record highs in places around the world. And with more trims expected in the next 12 months, shares could move even higher – assuming there’s not a major recession along the way.
Since 1980, the Federal Reserve (Fed) has cut interest rates 13 times when the S&P 500 was within 1% of a record high – just like now. And a year later, the S&P 500 was up every single time, with an average gain of 14.7% and a median gain of 17.5%.
Third, global liquidity’s still deep. There’s a close correlation between global liquidity and asset prices – the deeper the liquidity, the higher the asset prices – especially stocks.
Global liquidity has grown by 5.3%, compared to where it was a year ago. And it’s been picking up speed, too. The latest figures have it on track to rise at more than twice that pace over the next year. That’s because Chinese stimulus has been chucking money into the flow, the weaker US dollar means there’s more greenbacks around, and lower bond market volatility has boosted the value of collateral like Treasuries. And with the Fed likely putting an end to a three-year process of letting Treasuries and mortgage-backed securities roll off its balance sheet, that’s only going to deepen the flow.
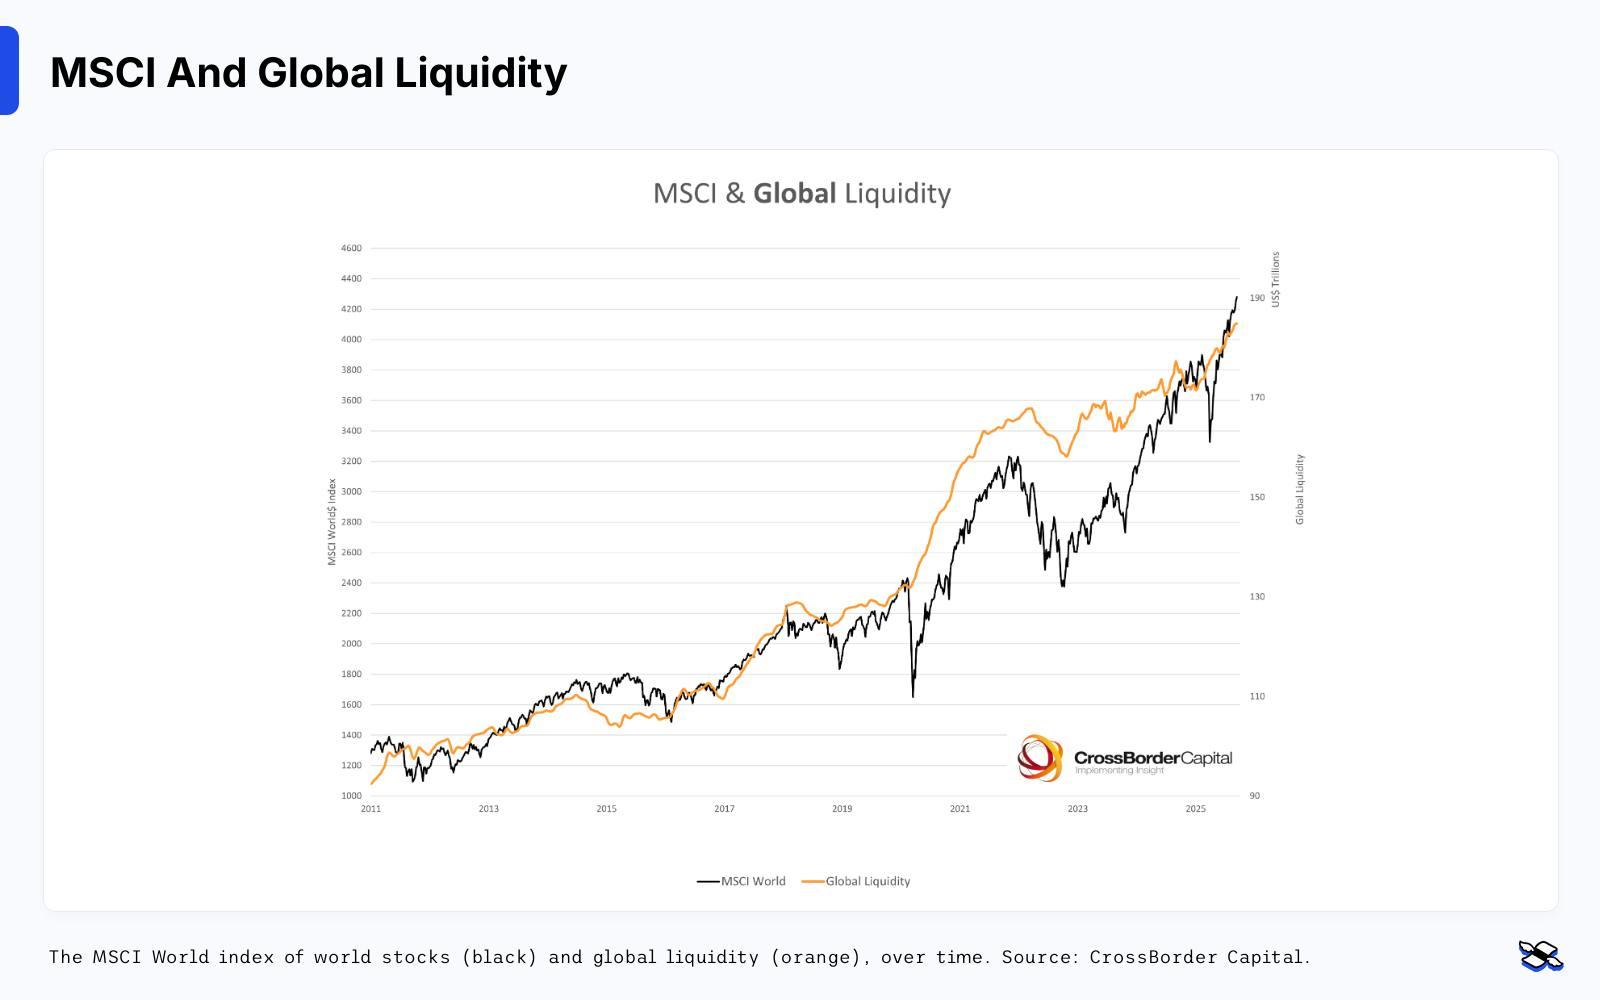
The MSCI World international stock index (black) and global liquidity (orange), over time. Source: CrossBorder Capital.
And three reasons to worry
Every month, Bank of America surveys hundreds of fund managers from around the world to find out how they’re investing and what’s on their minds. And in the latest go-round, three things were flashing red for those pros.
First and foremost, there’s AI bubble risk. AI is drawing massive investments, and most of it is being financed by Big Tech’s own balance sheets and free cash flow, which reduces the overall risks. But valuations have been rising, and the ecosystem has started to look a little circular. And, sure, valuations may not be at the dot-com levels right now, but the concentration risk has been building. Only a handful of firms have the cash and capital spending to play. And if AI fails to deliver real returns, the scale of funding it’s absorbing could turn into a broader economic risk.
Second, there’s the growth of private equity and credit. Recent bankruptcy filings – namely, from First Brands and Tricolor – and concerns about risk management have made private equity and credit the top systemic risk worry among the investing pros. And because private assets aren’t subject to daily market pricing, valuing them can be a stab in the dark. And as funding continues to flow into AI and energy infrastructure, the debt burden for these assets could grow faster than returns. The Bank of England even flagged this risk in a report this week. Goldman Sachs’s CEO says there’s no systemic risk looming – but that doesn’t mean there’s no problem.
Third, gold may have gone too far. After a string of all-new records, it’s no wonder 43% of fund managers said gold was the market’s “most crowded” trade (and therefore, at real risk of a pullback and plunge). And their concerns were prescient: the metal has since dropped 10%. That fall has taken some of the froth out of the gold momentum trade, but its price is still up nearly 50% this year, and the key drivers are still intact – central banks are still buying big and it’s still an attractive inflation hedge. Just this week, South Korea’s central bank hinted it might start buying gold for the first time in over a decade. Sometimes it takes a bull market to attract new buyers.
What’s an investor to do, then?
The most important thing is to keep your goals in mind. The rationale for a major stock sell-off almost always manages to sound… smarter. There’s usually plenty of evidence you can use to build an intellectually convincing argument as to why the market might soon go to the dogs. But the fact is, most financial doomsday warnings don’t actually come to anything. And sitting in cash, with inflation eating away at your purchasing power while you wait for a sell-off, can be a very expensive exercise.
But investing isn’t a pick-a-side-and-stick-with-it type of game. A savvy investing mix diversifies across assets and braces for a range of scenarios.
Russell Burns is an analyst at finimize.
ii and finimize are both part of Aberdeen.
finimize is a newsletter, app and community providing investing insights for individual investors.
Aberdeen is a global investment company that helps customers plan, save and invest for their future.
These articles are provided for information purposes only. Occasionally, an opinion about whether to buy or sell a specific investment may be provided by third parties. The content is not intended to be a personal recommendation to buy or sell any financial instrument or product, or to adopt any investment strategy as it is not provided based on an assessment of your investing knowledge and experience, your financial situation or your investment objectives. The value of your investments, and the income derived from them, may go down as well as up. You may not get back all the money that you invest. The investments referred to in this article may not be suitable for all investors, and if in doubt, an investor should seek advice from a qualified investment adviser.
Full performance can be found on the company or index summary page on the interactive investor website. Simply click on the company's or index name highlighted in the article.