Why has the US market not fallen as much as it did during the 2008 financial crisis?
With the world facing the worst economic downturn since the Great Depression, surely the market should h…
27th April 2020 10:10
by Tom Bailey from interactive investor
With the world facing the worst economic downturn since the Great Depression, surely the market should have fallen further?

The past six weeks have been a bloodbath for investors. As the risk of coronavirus became apparent, governments around the world introduced lockdowns, putting a pause on economic growth and wiping out the earnings of companies.
This finally killed the post-financial crisis bull market in the US, with the S&P 500 falling roughly 35% from its peak to its trough. Since then the US market has staged somewhat of a recovery, now sitting at less than 20% down from its peak.
To many, however, talk of a market recovery is too soon, with the market likely to fall further. There are several arguments for this.
For instance, many have pointed out the regularity of rallies in the midst of previous bear markets, with some of the best one-day returns for the S&P 500 being in October 2008. Others have pointed out that the sort of stocks leading the current rally are not the sort to usually lead an actual recovery.
For many market commentators, however, the size of US markets’ peak-to-trough appears too small compared to previous market falls. For instance, as a result of the 2008 financial crisis, the S&P 500 lost over 55% of its value, while in the early 2000s, with the tech bubble bursting, the index lost 49%. Meanwhile, at the start of the Great Depression, between 1929 and 1932 the US market lost 80%.
Compared to these previous declines, the market’s 35% peak-to-trough just feels too small. With the world facing potentially the worst economic downturn since the Great Depression, surely we should expect a drawdown at least on par with the 2008 financial crisis? The market must have further to fall, many argue.
Further declines are, of course, a real possibility. Recent chaos in oil markets appears to have spooked markets again. Bad news relating to the development of a vaccine or increased fears of a second wave of infections could see investors once again turn bearish.
However, while all the above is possible and perhaps even likely, we should be cautious about comparing the current drawdown to previous bear markets. When the structure and characteristics of the market before the crisis are taken into account, the 35% decline does not look so small.
First, it should be noted that compared to 2008 or the early 2000s, the market decline now is not the result a collapse in a previously leading sector or the bursting of an asset bubble.
The last two big market crashes were led by the deflation of specific sectors following an asset bubble bursting. For example, in the run up to the 2008 financial crisis, financials were the largest part of the market, accounting for around 20% of the S&P 500 index (today it is 12%). Given the cause and trigger of this crisis, banks saw heavy falls. So the size of the decline was largely determined by banks being both the largest part of the market and being among the worst hit. Likewise, information technology stocks accounted for 35% of the S&P 500 in 2000.
There is no such equivalent in the current crisis. This time around, the market has fallen on the expectation that the lockdowns will severely reduce the earning potential of most companies and increase the risk of some companies going bust, not the collapse of a previously leading sector.
The closest such sector would be large cap tech stocks such as Amazon or Google. Owing to their rich valuations many commentators have suggested such stocks are in bubble territory. But whatever truth there is in that, in the current market decline, large cap tech stocks have held up well. Indeed, Amazon is up over 10% since 19 February.
And that leads us to the next potential reason the market has held up better so far. According to data from Lawrence Hamtil of Fortune Financial Advisors, if the index had the same sector weighting in the current crisis as it did before the 2008 financial crisis, the market would have fallen further.
In the table below Hamtil applies the sector weighting of the index in 2007 to the market today. He then measures the declines those sectors experienced in the recent sell-off. With this he can then conclude that had the market in 2020 had the same sector weighting in as it did in 2007, it would have taken a noticeably larger fall.
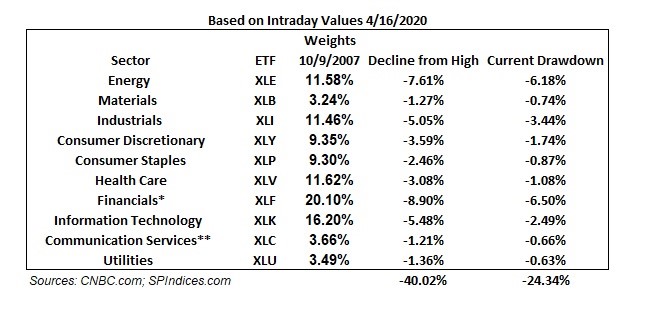
Hamitl says: “If we had gone into this with the sector weights of October 2007, we would have dropped roughly 40% peak-to-trough.”
The difference between the falls, while not huge, illustrates an important point: some sectors tend to fall more in market sell-offs and recessions than others. The size of such sectors, therefore, will help determine the size of the drawdown. If more cyclical sectors form a higher part of the index you can expect the index to fall further.
None of this is to say the market will face a bigger decline. Further bad news is possible. At the same time, most bear markets have taken several months or even years to find the bottom. But either way, any attempt at historical comparison should keep in mind the differences between different bear markets and the importance of the sector composition of the index being looked at.
This article was originally published in our sister magazine Money Observer, which ceased publication in August 2020.
These articles are provided for information purposes only. Occasionally, an opinion about whether to buy or sell a specific investment may be provided by third parties. The content is not intended to be a personal recommendation to buy or sell any financial instrument or product, or to adopt any investment strategy as it is not provided based on an assessment of your investing knowledge and experience, your financial situation or your investment objectives. The value of your investments, and the income derived from them, may go down as well as up. You may not get back all the money that you invest. The investments referred to in this article may not be suitable for all investors, and if in doubt, an investor should seek advice from a qualified investment adviser.
Full performance can be found on the company or index summary page on the interactive investor website. Simply click on the company's or index name highlighted in the article.