Why National Grid shares may not be quite so defensive
12th December 2018 08:48
by Alistair Strang from Trends and Targets
This popular income share has experienced a volatile year, and technical analyst Alistair Strang fears the yield may grow further still as the charts point south.
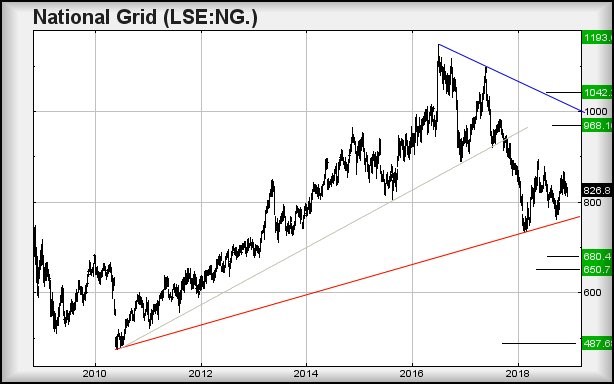
National Grid (LSE:NG.)
For some reason we're rarely asked about this behemoth - until today.
At present, National Grid is trading around the 826p level, with the price fluctuating broadly in tune with market nonsense this year relating to Brexit. There are now some very real risks apparent.
Essentially, weakness below red on the chart, 760p at present, would be viewed as a bad thing, moving the price into a region where an initial 680p looks capable of provoking a short-lived bounce. The real problem, should 680p break, is any real bounce dare not be anticipated until the price reverses as far as 650p.
In common with everything else, market fragility at present almost demands we supply an "ultimate" bottom, if everything opts to fall apart. In the case of National Grid, bottom is now 487p, a point we cannot calculate below.
Visually, it ties against the lows of the last market collapse - which oddly took until 2010 to inflict itself on National Grid. In the event 487p ever makes a guest appearance, it appears a welcome level to try a pretty firm long position, one with a tight stop.
At present, the share requires better than 906p to indicate it intends to climb out of trouble.
Ideally, we would prefer the price closes above 906p to confirm the potentials. This scenario expects recovery to an initial 968p. If exceeded, secondary calculates at 1,042p and a game changing position.
For now, we rather suspect 650p shall make an appearance.
Source: Trends and Targets Past performance is not a guide to future performance
Alistair Strang has led high-profile and "top secret" software projects since the late 1970s and won the original John Logie Baird Award for inventors and innovators. After the financial crash, he wanted to know "how it worked" with a view to mimicking existing trading formulas and predicting what was coming next. His results speak for themselves as he continually refines the methodology.
Alistair Strang is a freelance contributor and not a direct employee of Interactive Investor. All correspondence is with Alistair Strang, who for these purposes is deemed a third-party supplier. Buying, selling and investing in shares is not without risk. Market and company movement will affect your performance and you may get back less than you invest. Neither Alistair Strang or Interactive Investor will be responsible for any losses that may be incurred as a result of following a trading idea.
These articles are provided for information purposes only. Occasionally, an opinion about whether to buy or sell a specific investment may be provided by third parties. The content is not intended to be a personal recommendation to buy or sell any financial instrument or product, or to adopt any investment strategy as it is not provided based on an assessment of your investing knowledge and experience, your financial situation or your investment objectives. The value of your investments, and the income derived from them, may go down as well as up. You may not get back all the money that you invest. The investments referred to in this article may not be suitable for all investors, and if in doubt, an investor should seek advice from a qualified investment adviser.
Full performance can be found on the company or index summary page on the interactive investor website. Simply click on the company's or index name highlighted in the article.