Why UK Oil & Gas chart shows potential
17th May 2018 09:35
by Alistair Strang from Trends and Targets
UK Oil & Gas (LSE:UKOG)
Launching directly into "boring" probably isn't the best way to start a riveting report. Alas, has displayed one of these charty things which always bears some scrutiny, the often ignored and derided "Flying Monkey" pattern.
Okay, it was clickbait. There's no such pattern - to our knowledge - but it doesn't avoid an interesting potential making itself known with recent price movements.
Firstly, though, there is a tiny little issue worth mentioning against this share and the "shark" cartoon gives a pretty evident clue.
When the price of UKOG moved below 1.6p, it entered territory where we cannot calculate any realistic bottom. We're inclined to some hope though, simply due to the price failing to collapse further. Instead, it's swimming in circles just below the 1.6p level.
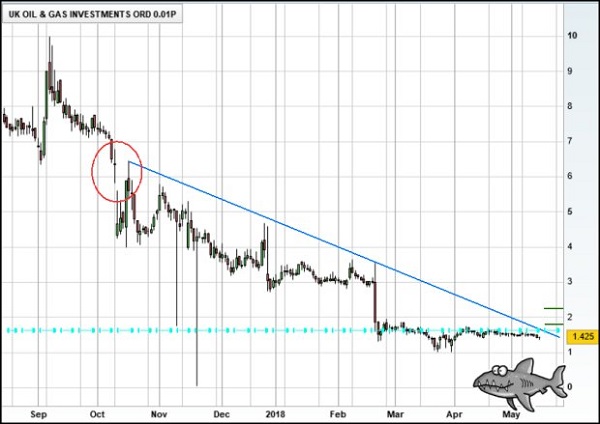
Our interest was piqued due to two features. The fact it's still trading appears to be useful and, there's the blue line on the chart. We regard manipulation gaps on share prices (circled) as defining new trends commencing. Therefore, if it's a downtrend we paint a blue line through the highs following the gap. Or if an uptrend, we paint through the lows.
In the case of UKOG, the visuals indicate the price is indeed reacting to the trend and thus, price movements bettering blue - around 1.6p - suggest coming movement to a fairly useless 1.8p. In the event 1.8p is bettered, we'd hope for some further recovery to 2.2p at which point we shall need run the numbers again. The "issue" is, above 2.2p and the price sends a signal bottom is in and thus, further growth becomes probable.
For now though, it's trading in a range where we cannot calculate a bottom. But we can use our shark icon!
Source: interactive investor Past performance is not a guide to future performance
Alistair Strang has led high-profile and "top secret" software projects since the late 1970s and won the original John Logie Baird Award for inventors and innovators. After the financial crash, he wanted to know "how it worked" with a view to mimicking existing trading formulas and predicting what was coming next. His results speak for themselves as he continually refines the methodology.
Alistair Strang is a freelance contributor and not a direct employee of Interactive Investor. All correspondence is with Alistair Strang, who for these purposes is deemed a third-party supplier. Buying, selling and investing in shares is not without risk. Market and company movement will affect your performance and you may get back less than you invest. Neither Alistair Strang, Shareprice, or Interactive Investor will be responsible for any losses that may be incurred as a result of following a trading idea.
Full performance can be found on the company or index summary page on the interactive investor website. Simply click on the company's or index name highlighted in the article.
These articles are provided for information purposes only. Occasionally, an opinion about whether to buy or sell a specific investment may be provided by third parties. The content is not intended to be a personal recommendation to buy or sell any financial instrument or product, or to adopt any investment strategy as it is not provided based on an assessment of your investing knowledge and experience, your financial situation or your investment objectives. The value of your investments, and the income derived from them, may go down as well as up. You may not get back all the money that you invest. The investments referred to in this article may not be suitable for all investors, and if in doubt, an investor should seek advice from a qualified investment adviser.
Full performance can be found on the company or index summary page on the interactive investor website. Simply click on the company's or index name highlighted in the article.