Analysis: looking further afield for inspiration
5th July 2022 07:44
by Alistair Strang from Trends and Targets
This index has broken below an established uptrend, but what does it mean for investors? Independent analyst Alistair Strang explains.

Market volumes appear to have gone through the floor for the start of July. Quite literally, the financial value of trades through the LSE appear to have dropped 25% in the first couple of days trading this month, far from encouraging, the dip also substantially below fiscal levels for the same period in 2020 and 2021.
Goodness knows how the holiday month of August will perform. Needless to say, we shall be keeping a weather eye on this, due to low volumes never being associated with a vibrant happy marketplace.
We’ve been asked to include the Euro STOXX 50 in our daily deliberations, but before we start, we opted to take a bigger picture glance at the index.
One fair criticism of the Dax and the CAC is the proliferation of trading gaps, making it a difficult and dangerous to place ‘fire and forget’ orders. Few things are more annoying than a carefully thought out trading scenario being skipped over, due to a market gap appearing for usually unknown reasons. The STOXX 50 certainly appears less infected by trading gaps, this being a primary reason why some traders are apparently switching from Germany and France.
One thing which immediately managed a “sore thumb” impersonation was a series of market movements on the chart, just as June drizzled to a close. We’re always a little interested when something breaks below an established uptrend as it’s often a pretty sane early warning signal of coming trauma.
The converse can often prove equally true and the STOXX 50 managed it in glorious technocolour. On the 27 and 28 June, the index poked above the uptrend, yet failed to actually close above Red.
The two chart insets below show what happened, quite clearly advising anyone paying attention that this Red uptrend in important and the market is aware of it. The care with which the market ensured the index was not permitted to close a session in safety is extremely interesting, almost promising future closure above Red shall be a pretty safe indicator of coming gains. However, if we toss our suspicions to the side, the immediate prospects are not encouraging.
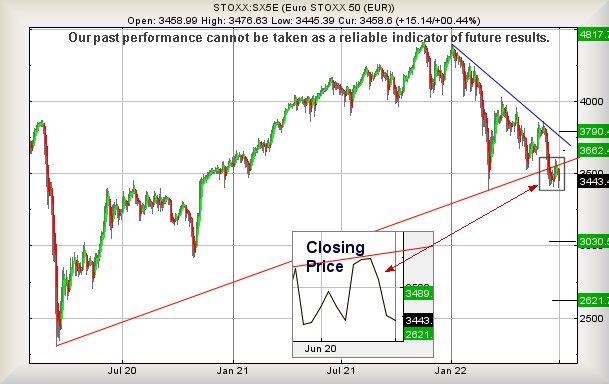
Past performance is not a guide to future performance.
Now below 3,430 points risks triggering some painful reversals, threatening a cycle down to an initial 3,030 points. Should such a level break, our ‘longer term’ secondary works out at 2,621 points and hopefully a solid bottom. Unfortunately, visually each target level makes quite a lot of sense.
Our alternate is a little easier on the eye, the index needing above 3,490 to hopefully trigger a cycle of surprise gains to an initial 3,662 points with secondary, if exceeded, calculating at a game changing (for the longer term) 3,790 points.
We suspect the STOXX 50 shall prove interesting, as currently the index doesn’t ‘feel’ like it wants to go down. Unfortunately, the market has also placed itself in a position where world events can force swift reversals while the index loiters below Red on the chart.
Alistair Strang has led high-profile and "top secret" software projects since the late 1970s and won the original John Logie Baird Award for inventors and innovators. After the financial crash, he wanted to know "how it worked" with a view to mimicking existing trading formulas and predicting what was coming next. His results speak for themselves as he continually refines the methodology.
Alistair Strang is a freelance contributor and not a direct employee of Interactive Investor. All correspondence is with Alistair Strang, who for these purposes is deemed a third-party supplier. Buying, selling and investing in shares is not without risk. Market and company movement will affect your performance and you may get back less than you invest. Neither Alistair Strang or Interactive Investor will be responsible for any losses that may be incurred as a result of following a trading idea.
These articles are provided for information purposes only. Occasionally, an opinion about whether to buy or sell a specific investment may be provided by third parties. The content is not intended to be a personal recommendation to buy or sell any financial instrument or product, or to adopt any investment strategy as it is not provided based on an assessment of your investing knowledge and experience, your financial situation or your investment objectives. The value of your investments, and the income derived from them, may go down as well as up. You may not get back all the money that you invest. The investments referred to in this article may not be suitable for all investors, and if in doubt, an investor should seek advice from a qualified investment adviser.
Full performance can be found on the company or index summary page on the interactive investor website. Simply click on the company's or index name highlighted in the article.