Analysis: oil prices and NatWest shares
With oil prices on the rise and share prices heading in the opposite direction, independent analyst Alistair Strang has run fresh charts with new targets.
9th March 2026 07:45
by Alistair Strang from Trends and Targets

Brent Crude has been “gapped” above our theoretical $97 top from our analysis last week.
When we see this sort of thing, we’re generally a little bit chuffed as it “proves” we’ve been mapping the correct trend, due to the market opting to manipulate the price above our probable top.
- Invest with ii:Open a Stocks & Shares ISA | Top ISA Funds | Transfer your ISA to ii
However, it also effectively kicks things a little out of kilter, forcing us to rely on price movements since the gap up, as we attempt to extrapolate and figure out what the future may hold.
The immediate situation for Brent crude implies movement above $117 threatens a visit to $122 next with our secondary, if bettered, a potential ceiling at $131. Visually, such a ceiling makes a lot of sense, matching the conflated level achieved after Russia's invasion of Ukraine four years ago, achieving a high almost identical to our $131.
We suspect the current rising cycle for Brent is ‘fake’. Hopefully, reversal to the $60/50 range shall prove fairly swift.
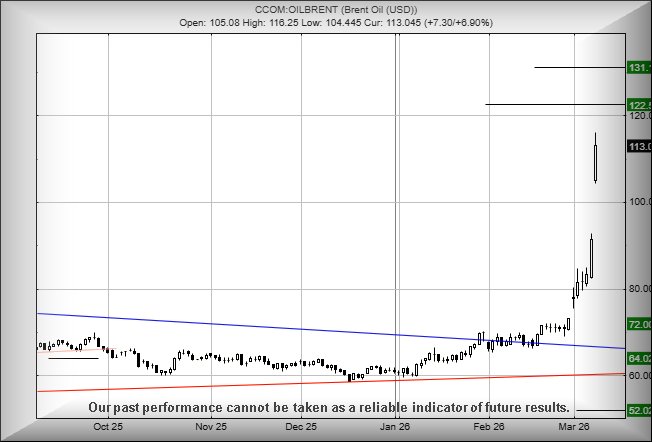
Source: Trends and Targets. Past performance is not a guide to future performance. Important: Trends and Targets charts only incorporate official share count consolidations, ignoring rights issues where investors have a choice as to whether to participate.
NatWest Group (LSE:NWG), successfully achieving both targets from our previous analysis has inevitably fallen victim to the depression currently being caused by activities in the Gulf. It is genuinely annoying, where shares whose value should not be infected, are instead forced to retreat.
Above 591p risks proving useful, calculating with the potential of a lift to an initial 606p with our secondary, if bettered, at 620p and probable hesitation. While the big picture paints a future 634p as exerting an attraction, visually there is a strong argument to anticipate some reversals at such a level.
However, below 567p looks problematic, giving the potential of reversal to an initial 553p with our secondary, if broken, at 526p and a very, very, probable bottom. Should such a level break, the Big Picture signals a visit to 510p as possible, breaking the immediate uptrend along with – more dangerously – the long term blue downtrend.
We think NWG shall be scheduled to bounce, somewhere between 553p and 526p.
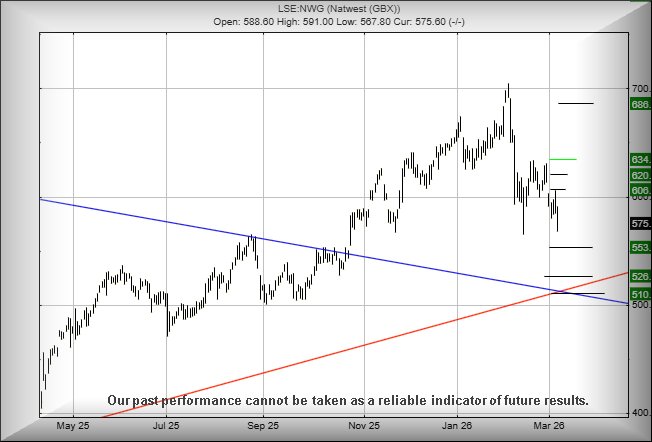
Source: Trends and Targets. Past performance is not a guide to future performance. Important: Trends and Targets charts only incorporate official share count consolidations, ignoring rights issues where investors have a choice as to whether to participate.
Alistair Strang has led high-profile and "top secret" software projects since the late 1970s and won the original John Logie Baird Award for inventors and innovators. After the financial crash, he wanted to know "how it worked" with a view to mimicking existing trading formulas and predicting what was coming next. His results speak for themselves as he continually refines the methodology.
Alistair Strang is a freelance contributor and not a direct employee of Interactive Investor. All correspondence is with Alistair Strang, who for these purposes is deemed a third-party supplier. Buying, selling and investing in shares is not without risk. Market and company movement will affect your performance and you may get back less than you invest. Neither Alistair Strang or Interactive Investor will be responsible for any losses that may be incurred as a result of following a trading idea.
These articles are provided for information purposes only. Occasionally, an opinion about whether to buy or sell a specific investment may be provided by third parties. The content is not intended to be a personal recommendation to buy or sell any financial instrument or product, or to adopt any investment strategy as it is not provided based on an assessment of your investing knowledge and experience, your financial situation or your investment objectives. The value of your investments, and the income derived from them, may go down as well as up. You may not get back all the money that you invest. The investments referred to in this article may not be suitable for all investors, and if in doubt, an investor should seek advice from a qualified investment adviser.
Full performance can be found on the company or index summary page on the interactive investor website. Simply click on the company's or index name highlighted in the article.