Can Lloyds Bank shares recover from wobble?
Independent analyst Alistair Strang looks at a long-term trend and implications for the current share price.
27th April 2026 07:42
by Alistair Strang from Trends and Targets

The share price for Lloyds Banking Group (LSE:LLOY) has been doing something really surprising.
Once upon a time, Lloyds' share price was over 10 quid. In fact, in May 1999, ‘just’ 27 years ago, it was around 1,070p. Paying any attention to a trend spawned from this sort of nonsense would be utterly ridiculous, aside for something which is bugging us. Zooming in on price movements for Lloyds this year reveals something which we did not anticipate.
- Invest with ii:Open a Stocks & Shares ISA | Top ISA Funds | Transfer your ISA to ii
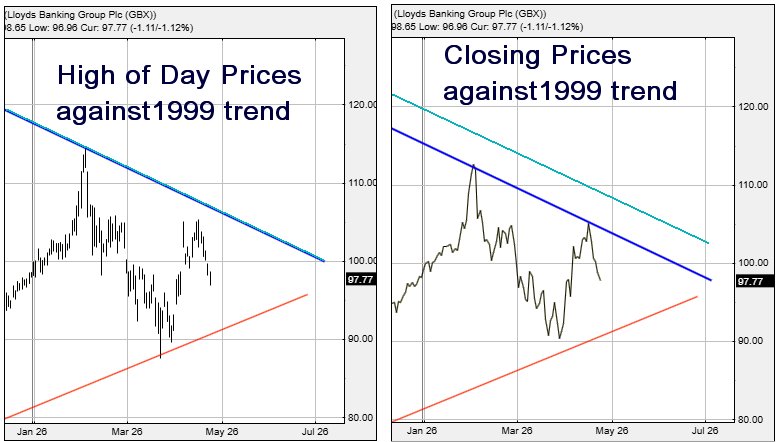
Source: Trends and Targets. Past performance is not a guide to future performance. Important: Trends and Targets charts only incorporate official share count consolidations, ignoring rights issues where investors have a choice as to whether to participate.
In our opinion, there should not be a valid downtrend since 1999 but, in the case of Lloyds, when we opt to view closing prices this year, they intersect rather neatly with the dark blue line dating back to May 1999.
While this may be a silly coincidence, we’re nervous about making such a finite statement as it’s extremely rare for the market to endure 'coincidence'; quite the opposite.
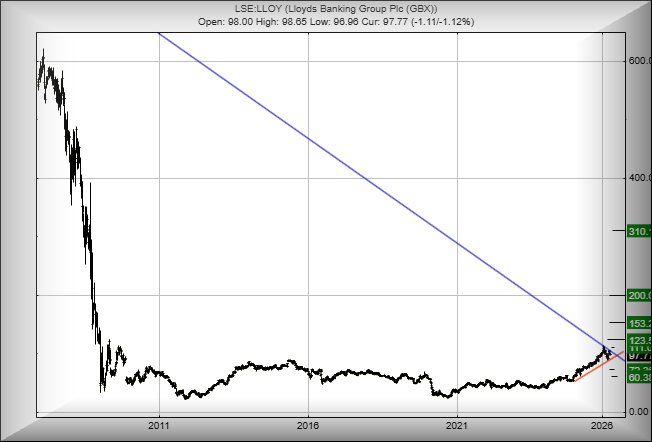
From our perspective, it creates a fascinating situation where we’re supposed to apply future strengths from a share price which was once over 10 quid. The implication is for a growth scenario which shall exhibit strength.
If we opt to muck around with a trend which perhaps commenced 27 years ago, things certainly get interesting with various degrees of acceleration. Currently, above 106p should next trigger movement to an initial 111p with our secondary, if beaten, at 123p.
While we anticipate some hesitation at this secondary level, the share price should move solidly into a Big Picture cycle, where a future third level target of 153p awaits. And for those with infinite patience, a long term 310p should be exerting an attractive influence. How hard can it be?
In the event things intend to go wrong, below 85p would be a bad thing, allowing for reversal to an initial 72p and, if this level breaks, our secondary – and potential bottom – calculates down at 60p.
Source: Trends and Targets. Past performance is not a guide to future performance. Important: Trends and Targets charts only incorporate official share count consolidations, ignoring rights issues where investors have a choice as to whether to participate.
Alistair Strang has led high-profile and "top secret" software projects since the late 1970s and won the original John Logie Baird Award for inventors and innovators. After the financial crash, he wanted to know "how it worked" with a view to mimicking existing trading formulas and predicting what was coming next. His results speak for themselves as he continually refines the methodology.
Alistair Strang is a freelance contributor and not a direct employee of Interactive Investor. All correspondence is with Alistair Strang, who for these purposes is deemed a third-party supplier. Buying, selling and investing in shares is not without risk. Market and company movement will affect your performance and you may get back less than you invest. Neither Alistair Strang or Interactive Investor will be responsible for any losses that may be incurred as a result of following a trading idea.
These articles are provided for information purposes only. Occasionally, an opinion about whether to buy or sell a specific investment may be provided by third parties. The content is not intended to be a personal recommendation to buy or sell any financial instrument or product, or to adopt any investment strategy as it is not provided based on an assessment of your investing knowledge and experience, your financial situation or your investment objectives. The value of your investments, and the income derived from them, may go down as well as up. You may not get back all the money that you invest. The investments referred to in this article may not be suitable for all investors, and if in doubt, an investor should seek advice from a qualified investment adviser.
Full performance can be found on the company or index summary page on the interactive investor website. Simply click on the company's or index name highlighted in the article.