Centrica shares dive despite hitting key targets and 9% dividend yield
22nd November 2018 11:00
by Lee Wild from interactive investor
There's a hit to profits and guidance is downgraded, but progress is being made elsewhere. Lee Wild, head of equity strategy at interactive investor, asks whether the dividend can be maintained long-term.

Centrica shares have underperformed the wider market significantly over the past five years, but done much better than the FTSE 100 index in 2018. However, a sprinkling of negatives in this third-quarter trading update have overshadowed solid progress in key areas.
Customer retention and the generous dividend payment have been and remain two major factors for shareholders. Centrica's British Gas arm has never been much good at the former, and another 372,000 customers have been lost in the past four months.
Regulator Ofgem's new default tariff price cap will also hit Centrica in the pocket, likely triggering a one-off hit to profit of £70 million at the start of 2019. However, this is small beer for Centrica, and won't make much of a dent in the annual profit figure, and Centrica expects to make more than last year.
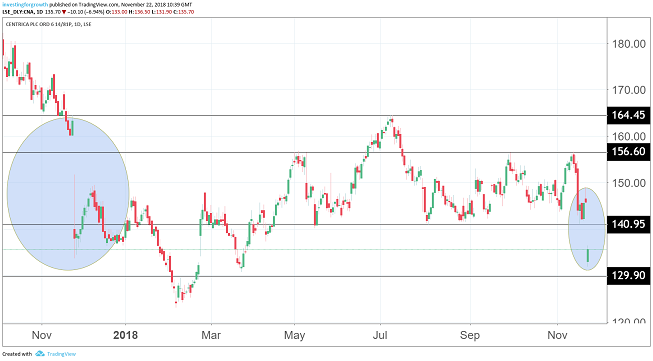
Source: TradingView (*) Past performance is not a guide to future performance
The Spirit Energy oil & gas production joint venture with Bayern gas Norge has disappointed, with output down from 50 to 47.5 million barrels of oil equivalent per day since the interim results. A shortfall at the nuclear division will also show up in the full-year numbers.
- The week ahead: Centrica, Kingfisher
- Should you be optimistic about Centrica and its 8% dividend yield?
- A blue chip to buy for huge yield
- Centrica's dividend survives, for now
Despite these short-term volume shocks, Centrica is on track to save over £200 million this year and is throwing off lots of cash. With just a few weeks to go until year-end, both adjusted operating cash flow at £2.1-£2.3 billion and net debt at £2.5-£3 billion are bang on target. We won't know what the impact of accounting changes to net debt until final results in February.
Based on today's numbers, Centrica can easily afford the 12p annual dividend, but the market remains wary of anything that threatens the payout.
*Horizontal lines on charts represent levels of previous technical support and resistance. Trendlines are marked in red.
These articles are provided for information purposes only. Occasionally, an opinion about whether to buy or sell a specific investment may be provided by third parties. The content is not intended to be a personal recommendation to buy or sell any financial instrument or product, or to adopt any investment strategy as it is not provided based on an assessment of your investing knowledge and experience, your financial situation or your investment objectives. The value of your investments, and the income derived from them, may go down as well as up. You may not get back all the money that you invest. The investments referred to in this article may not be suitable for all investors, and if in doubt, an investor should seek advice from a qualified investment adviser.
Full performance can be found on the company or index summary page on the interactive investor website. Simply click on the company's or index name highlighted in the article.