Charts of the week: FTSE 100, Nasdaq, gold, oil and metals
Global markets have recovered but risk management matters. Parsa Kiani explains what the major charts are telling us and why equities are not the only asset class sending important signals.
15th April 2026 13:43
by Parsa Kiani from Aberdeen

Overall
Following more constructive headlines around a potential peace agreement, global equity markets have staged a further recovery. While headlines remain noisy, so far, the local low was put in on 30 March. As is often the case, markets have been quicker to process information than commentators.
That said, not all indices tell the same story, and it would be premature to declare that equity markets are fully out of the woods. While technical conditions are broadly supportive, several markets are now coming off more than 10 consecutive days of gains and are approaching well-defined resistance levels. At this stage of the move, disciplined risk management becomes essential, particularly for investors considering new exposure rather than managing existing positions.
Before the conflict began, equity leadership was clearly aligned with semiconductors and AI hardware, while renewed “rest-of-the-world” interest helped non-US markets outperform. US equities, meanwhile, have proven more resilient than initially expected, although price action there remains largely rangebound.
Below, we look in more detail at what the major charts are telling us.
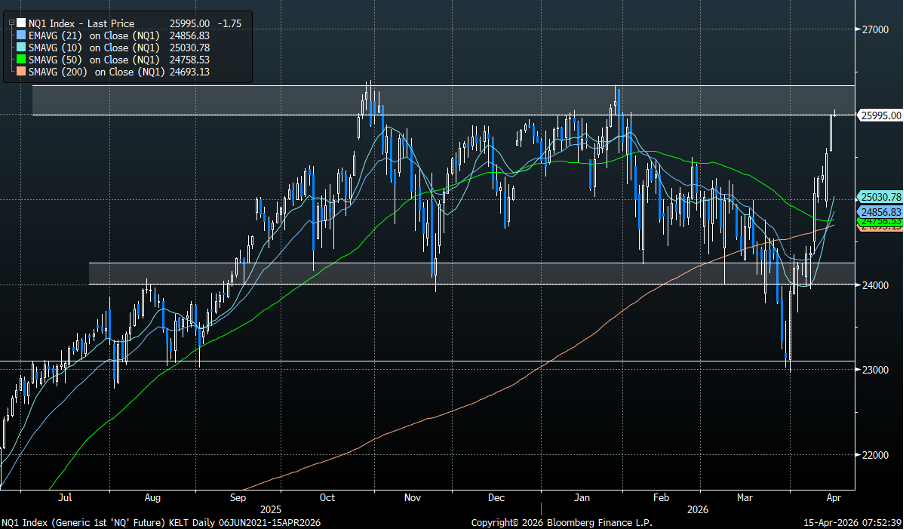
Nasdaq 100
Major US equity benchmarks, the S&P 500 and Nasdaq 100, have enjoyed a strong rebound since late March. However, the rally has brought prices back into the same sideways trading range that capped upside prior to the conflict.
This zone has acted as a meaningful resistance area before, and the market’s reaction here will be instructive. The positive development is that key moving averages are beginning to re-stack, improving the technical backdrop and potentially offering support should markets pull back.
For now, this remains a market that is improving but not yet resolved. A sustained breakout would materially improve the outlook; failure at resistance would reinforce the case for patience.
Source: Bloomberg. Past performance is not a guide to future performance.
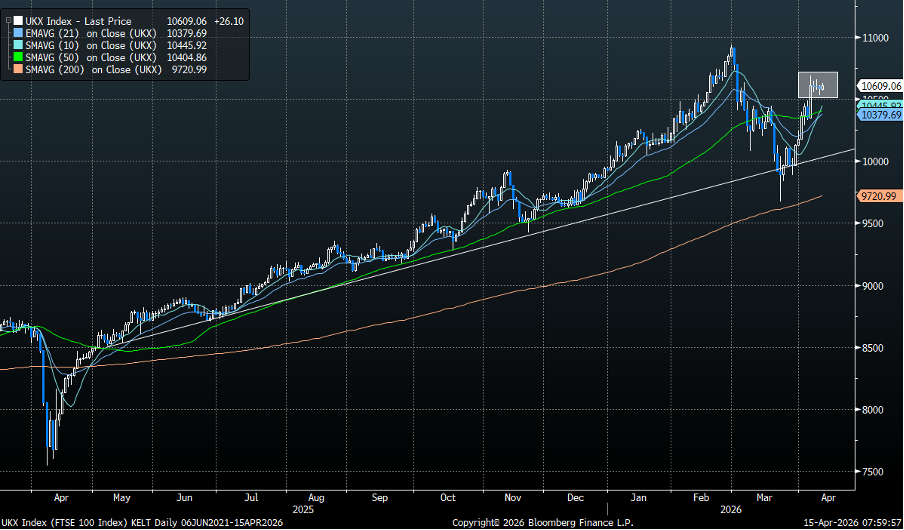
FTSE 100
The FTSE 100 entered the conflict period with a structurally stronger chart, which helped it preserve technical integrity during the sell-off. The index found support at its 200-day moving average, and that bounce has since been followed by a strong push higher.
Momentum, however, now appears to be slowing. From here, the very short-term price action looks more consistent with sideways consolidation rather than acceleration. This developing platform could ultimately prove constructive, particularly if the index allows its 10-day and 21-day moving averages to catch up before the next leg higher.
Relative to many global peers, this remains a healthier technical set-up, but, like elsewhere, confirmation is still required.
Source: Bloomberg. Past performance is not a guide to future performance.
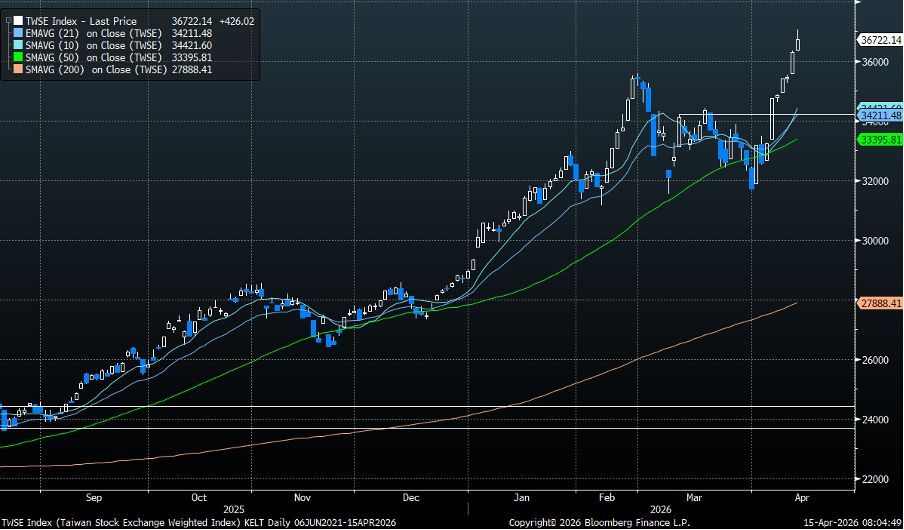
Taiwan TAIEX Index
The Taiwan TAIEX delivered one of the strongest rallies pre-conflict, supported by the ongoing semiconductor leadership theme. During the correction, the index quickly recovered above its 50-day moving average, suggesting that the primary uptrend remains intact.
The recent weakness looks more like a mean-reversion move rather than trend deterioration. That said, the sharp rebound has once again pushed the index a considerable distance above short-term moving averages.
This creates an important distinction: the longer-term trend remains decidedly strong, but near-term risk has increased. For existing holders, this is supportive; for new investors, however, entries here risk becoming chasey.
Source: Bloomberg. Past performance is not a guide to future performance.
Beyond equities: commodities in focus
Equities are not the only asset class sending important signals. Commodities, particularly gold and oil, remain highly relevant inputs for portfolio positioning.
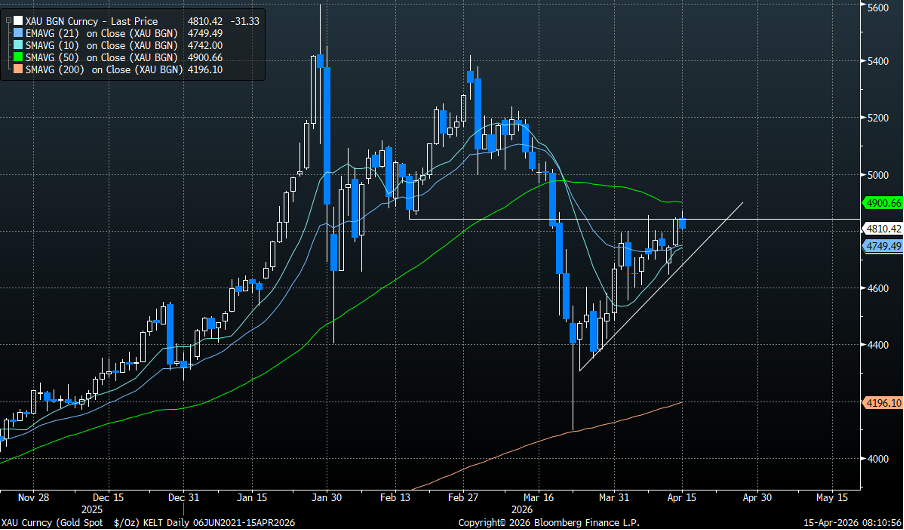
Gold
Gold’s behaviour over recent months has been complex. At various times, it has acted as both a safe haven and a risk-sensitive asset, with its role shifting as narratives around macro drivers have evolved.
While the broader 2025 uptrend reinforced bullish conviction, the sell-off into the conflict has introduced a degree of uncertainty. From here, does it matter whether gold recovers alongside equities, or does it begin to lag?
Technically, the picture is much better than it was last week but remains unresolved. A decisive move back above the 50-day moving average and prior resistance would stabilise the set-up. Failure to do so would suggest continued hesitation.
Source: Bloomberg. Past performance is not a guide to future performance.
Oil
Oil has understandably dominated investor attention, but at this stage of the conflict the more informative signals lie beyond the front month contracts. Near-dated futures have been more directly affected by ceasefire dynamics and currently sit below short-term moving averages.
By contrast, longer-dated contracts remain technically better supported. As an example, Brent crude (December 2026 contract) continues to trade above its key moving averages.
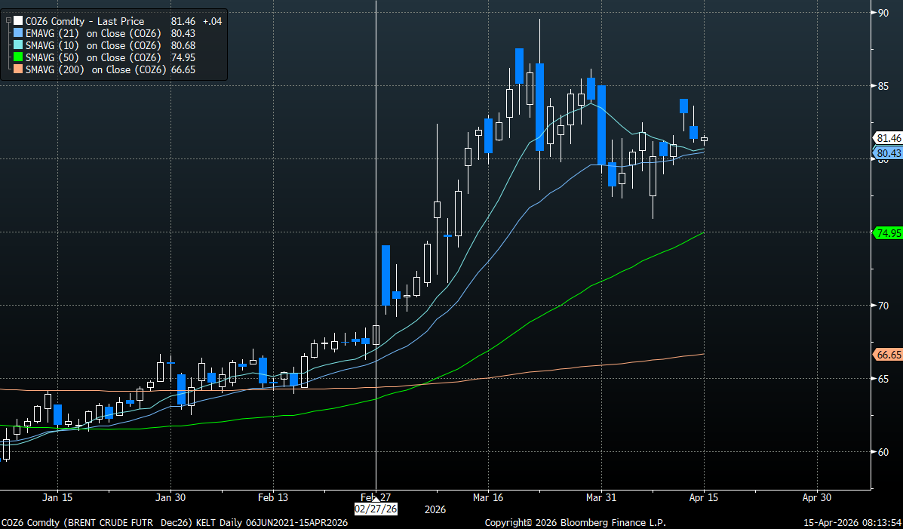
Source: Bloomberg. Past performance is not a guide to future performance.
Industrial metals
Finally, the Bloomberg Commodity Industrial Metals Sub-Index deserves attention. The chart speaks for itself. Strength here can reinforce the narrative around global industrial demand and structural heavy assets investment themes:
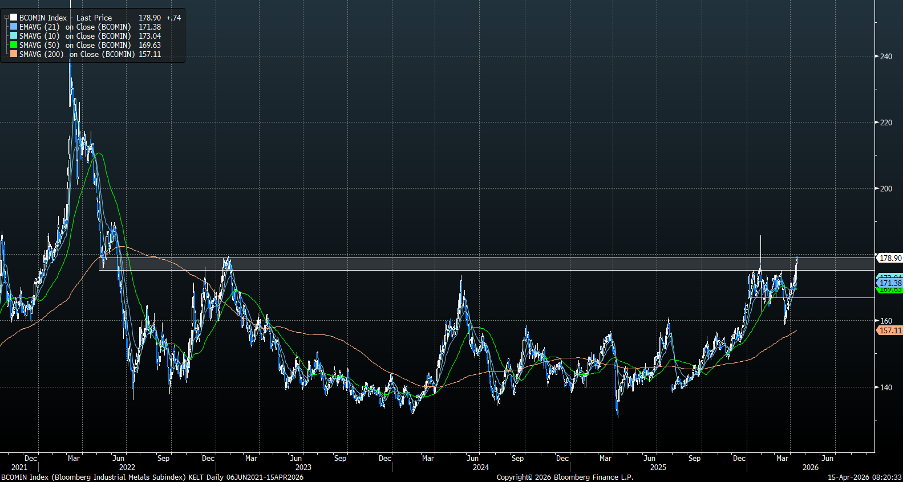
Source: Bloomberg. Past performance is not a guide to future performance.
Bottom line
Markets have stabilised and recovered meaningfully, but they are now approaching levels where selectivity and discipline matter more than speed. Trends are improving, but confirmation is still pending across several key indices. In this environment, managing exposure is just as important as identifying opportunity.
Parsa Kiani is an investment manager working on the Aberdeen macro investments team.
The team conducts macro and technical analysis across multiple time frames, helping them manage portfolios dynamically and generate differentiated return streams. Technical analysis is used most actively for their shorter-term tactical risk taking.
The author would like to stress that technical analysis should not be understood as determining the future path of financial markets.
These articles are provided for information purposes only. Occasionally, an opinion about whether to buy or sell a specific investment may be provided by third parties. The content is not intended to be a personal recommendation to buy or sell any financial instrument or product, or to adopt any investment strategy as it is not provided based on an assessment of your investing knowledge and experience, your financial situation or your investment objectives. The value of your investments, and the income derived from them, may go down as well as up. You may not get back all the money that you invest. The investments referred to in this article may not be suitable for all investors, and if in doubt, an investor should seek advice from a qualified investment adviser.
Full performance can be found on the company or index summary page on the interactive investor website. Simply click on the company's or index name highlighted in the article.
Disclosure
We use a combination of fundamental and technical analysis in forming our view as to the valuation and prospects of an investment. Where relevant we have set out those particular matters we think are important in the above article, but further detail can be found here.
Please note that our article on this investment should not be considered to be a regular publication.
Details of all recommendations issued by ii during the previous 12-month period can be found here.
ii adheres to a strict code of conduct. Contributors may hold shares or have other interests in companies included in these portfolios, which could create a conflict of interests. Contributors intending to write about any financial instruments in which they have an interest are required to disclose such interest to ii and in the article itself. ii will at all times consider whether such interest impairs the objectivity of the recommendation.
In addition, individuals involved in the production of investment articles are subject to a personal account dealing restriction, which prevents them from placing a transaction in the specified instrument(s) for a period before and for five working days after such publication. This is to avoid personal interests conflicting with the interests of the recipients of those investment articles.