‘Fingers crossed’ time for this minor gold miner
Its share price has been static in 2021, but could be set for greater things.
27th April 2021 08:56
by Alistair Strang from Trends and Targets
Its share price has been static in 2021, but could be set for greater things.

Kefi Gold & Copper Plc
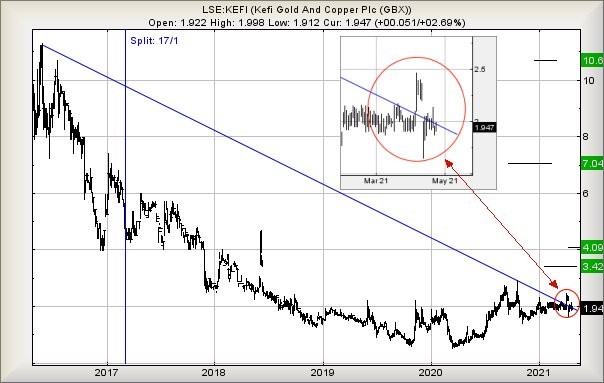
Since reviewing this minor miner, Kefi (LSE:KEFI), in 2020, its share price successfully achieved our initial target level of 2.5p but has yet to achieve our secondary ambition. If only due to their name change from Kefi Minerals to a focussed Kefi Gold & Copper, a further glance at the tea leaves should be justified, thanks to the share price essentially flatlining thus far in 2021.
In fairness, this could even be a reflection on the price of gold, thanks to the metal price not enjoying a particularly interesting start to 2021, with a fairly placid $200 (£144) trading range.
Unfortunately, there's a pretty convincing logic currently suggesting the price of gold intends to bottom at around $1,530 once it finds sufficient excuse. The metal must exceed $1,870 just to escape the trend. Despite recent improvements in the price of copper we doubt these shall prove capable of offsetting a misbehaving gold price. A glance at Kefi’s website shows it is full of optimism for forthcoming results, both from Saudi Arabia and Ethiopia.
Our normal preference is to establish a ‘safe’ trigger level when examining upward travel potentials. But in the case of Kefi the share price did something silly at the start of April, shown as an inset on the chart.
- Key takeaways from the fund winners and losers in first quarter
- Insider: directors pile into this dividend stock
- Why reading charts can help you become a better investor
This sort of confusion was interesting as it confirmed the validity of the blue downtrend. The share surged above the trend, enjoyed a couple of days in the sun, then suddenly the market decided ‘nope’ and on 14 April the price was gapped down below the ruling downtrend.
At no time since has the share price been permitted to close a session above this trend. This perhaps indicates that trades above just 2.14p (the highest achieved since the price was forced down) shall suggest Kefi’s share price intends to go up with some integrity.
Our ‘safe’ trigger level is at 2.5p with a further trigger lurking at 2.97p for those who demand minimal levels of risk.
Visually, we're inclined to treat 2.5p as the sensible trigger. Achieving a slight movement from current to above 2.14p risks another (very rare) false start.
Above 2.5p should commence movement to an initial 3.4p with secondary, if exceeded, calculating at 4p. The secondary is quite a big deal, placing the share firmly in a zone where positive news flow could easily allow a future 7p to make its presence felt.
When we previously reviewed this, we'd suggested movement below 1p would justify panic. The current situation paints a picture where below 1.4p presents itself as the panic level.
In summary, the share price movement highlighted on the chart below should prove interesting, both confirming a trend and confirming the market was not ready to let the price run free. Generally, any second attempt upward will enjoy sharp and sudden price jumps. In plain English, it's 'fingers crossed' time.
Source: Trends and Targets. Past performance is not a guide to future performance
Alistair Strang has led high-profile and 'top secret' software projects since the late 1970s and won the original John Logie Baird Award for inventors and innovators. After the financial crash, he wanted to know 'how it worked' with a view to mimicking existing trading formulas and predicting what was coming next. His results speak for themselves as he continually refines the methodology.
Alistair Strang is a freelance contributor and not a direct employee of Interactive Investor. All correspondence is with Alistair Strang, who for these purposes is deemed a third-party supplier. Buying, selling and investing in shares is not without risk. Market and company movement will affect your performance and you may get back less than you invest. Neither Alistair Strang or Interactive Investor will be responsible for any losses that may be incurred as a result of following a trading idea.
These articles are provided for information purposes only. Occasionally, an opinion about whether to buy or sell a specific investment may be provided by third parties. The content is not intended to be a personal recommendation to buy or sell any financial instrument or product, or to adopt any investment strategy as it is not provided based on an assessment of your investing knowledge and experience, your financial situation or your investment objectives. The value of your investments, and the income derived from them, may go down as well as up. You may not get back all the money that you invest. The investments referred to in this article may not be suitable for all investors, and if in doubt, an investor should seek advice from a qualified investment adviser.
Full performance can be found on the company or index summary page on the interactive investor website. Simply click on the company's or index name highlighted in the article.