FTSE 100: why it’s immune to US optimism
The problem with chart patterns – and European grumpiness.
5th March 2021 08:46
by Alistair Strang from Trends and Targets
The problem with chart patterns – and European grumpiness.

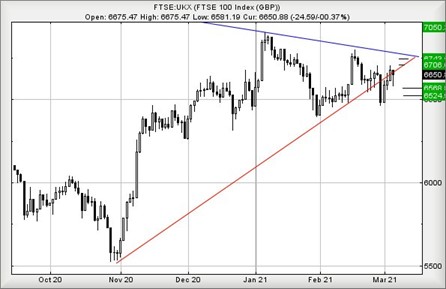
FTSE for Friday (FTSE:UKX)
We've a frequent problem with chart patterns, not least being their utter unreliability. It's often the case that something being true for one market proves to be the exact opposite in another.
Movements recently with the FTSE 100 and Wall Street are providing a perfect case in point, allowing us to enter 'teaching mode' for a welcome change.
The two charts below, dealing with the FTSE and Wall Street show an interesting movement with each index. Our point, essentially, would be a strong suspicion Wall Street would be about to surge upward, if only the US index had produced similar movements to the UK.
When an American index enacts this sequence, the steps are:
1. Break the trend
2. Follow the trend from below
3. Exceed the level of the original trend break and regains the prior trend.
We've learned to expect surprise future strength. When we apply our US model to the UK index, it translates with the potential of coming growth toward 7,040 points.
Unfortunately, a US model will rarely prove reliable when applied elsewhere, doubtless reflecting differences in thought processes from one side of the Atlantic to the other. In America, perpetual hope is backed up by action. "It's broken trend. No worries, it's going up again and look, it just regained the trend. Buy!"
- Shares round-up: three FTSE 100 stocks with optimism
- The FTSE a year on from the Covid crash
- Why reading charts can help you become a better investor
But in Europe, it’s more like: "It's broken trend. Don't trust it, the value is increasing but it just proved the trend line was weak. Sell!"
It's easy to snigger about this sort of nonsense, but there's little doubt the eternal optimism of America is a commodity often only found amongst the gullible in British internet chatrooms for certain AIM shares. If anyone is interested, we rather suspect the movement in the US index is a warning for imminent reversal to around 29,900 points, a level at which we'd hope for a rebound.
As for the FTSE for Friday, there are some slight potentials showing. Above 6,670 points calculates with an initial ambition of 6,708 points with secondary, if exceeded, at 6,743 points. If triggered, the very tightest stop looks wide at 6,615 points.
The alternate scenario allows for weakness below 6,608 to drive reversals to an initial 6,568 with secondary, when broken, at 6,523 points.
Have a good weekend!
Source: Trends and Targets. Past performance is not a guide to future performance
Alistair Strang has led high-profile and "top secret" software projects since the late 1970s and won the original John Logie Baird Award for inventors and innovators. After the financial crash, he wanted to know "how it worked" with a view to mimicking existing trading formulas and predicting what was coming next. His results speak for themselves as he continually refines the methodology.
Alistair Strang is a freelance contributor and not a direct employee of Interactive Investor. All correspondence is with Alistair Strang, who for these purposes is deemed a third-party supplier. Buying, selling and investing in shares is not without risk. Market and company movement will affect your performance and you may get back less than you invest. Neither Alistair Strang or Interactive Investor will be responsible for any losses that may be incurred as a result of following a trading idea.
These articles are provided for information purposes only. Occasionally, an opinion about whether to buy or sell a specific investment may be provided by third parties. The content is not intended to be a personal recommendation to buy or sell any financial instrument or product, or to adopt any investment strategy as it is not provided based on an assessment of your investing knowledge and experience, your financial situation or your investment objectives. The value of your investments, and the income derived from them, may go down as well as up. You may not get back all the money that you invest. The investments referred to in this article may not be suitable for all investors, and if in doubt, an investor should seek advice from a qualified investment adviser.
Full performance can be found on the company or index summary page on the interactive investor website. Simply click on the company's or index name highlighted in the article.